
Chaos Engineering: How it Works, Principles, Benefits, & Tools
Finding faults in a distributed system goes beyond the capability of standard application testing. Companies need smarter ways to test microservices continuously. One strategy that is gaining popularity is chaos engineering.
Using this proactive testing practice, an organization can look for and fix failures before they cause a costly outage. Read on to learn how chaos engineering improves the reliability of large-scale distributed systems.
What Is Chaos Engineering? Defined
Chaos engineering is a strategy for discovering vulnerabilities in a distributed system. This practice requires injecting failures and errors into software during production. Once you intentionally cause a bug, monitor the effects to see how the system responds to stress.
By “breaking things” on purpose, you discover new issues that could impact components and end-users. Address the identified weaknesses before they cause data loss or service impact.
Chaos engineering allows an admin to:
- Identify weak points in a system.
- See in real-time how a system responds to pressure.
- Prepare the team for real failures.
- Identify bugs that are yet to cause system-wide issues.
Netflix was the first organization to introduce chaos engineering. In 2010, the company released a tool called Chaos Monkey. With this tool, admins were able to cause failures in random places at random intervals. Such a testing approach made Netflix’s distributed cloud-based system much more resilient to faults.
Who Uses Chaos Engineering?
Many tech companies practice chaos engineering to improve the resilience of distributed systems. Netflix continues to pioneer the practice, but companies like Facebook, Google, Microsoft, and Amazon have similar testing models.
More traditional organizations have caught on to chaos testing too. For example, the National Australia Bank applied chaos to randomly shut down servers and build system resiliency.
The Need for Chaos Engineering
Peter Deutsch and his colleagues from Sun Microsystem listed eight false assumptions programmers commonly make about distributed systems:
- The network is reliable.
- There is zero latency.
- Bandwidth is infinite.
- The network is secure.
- Topology never changes.
- There is one admin.
- Transport cost is zero.
- The network is homogeneous.
These fallacies show the dynamics of a distributed application designed in a microservices architecture. This kind of system has many moving parts, and admins have little control over the cloud infrastructure.
Constant changes to the setup cause unexpected system behavior. It is impossible to predict these behaviors, but we can reproduce and test them with chaos engineering.
Difference Between Chaos Engineering and Failure Testing
A failure test examines a single condition and determines whether a property is true or false. Such a test breaks a system in a preconceived way. The results are usually binary, and they do not uncover new information about the application.
The goal of a chaos test is to generate new knowledge about the system. Broader scope and unpredictable outcomes enable you to learn about the system’s behaviors, properties, and performance. You open new avenues for exploration and see how you can improve the system.
While different, chaos and failure testing do have some overlap in concerns and tools used. You get the best results when you use both disciplines to test an application.
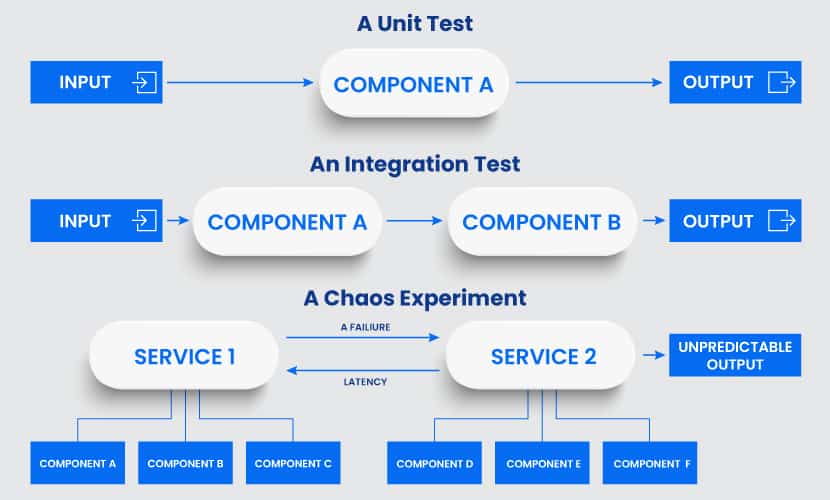
How Chaos Engineering Works
All testing in chaos engineering happens through so-called chaos experiments. Each experiment starts by injecting a specific fault into a system, such as latency, CPU failure, or a network black hole. Admins then observe and compare what they think will occur to what actually happens.
An experiment typically involves two groups of engineers. The first group controls the failure injection, and the second group deals with the effects.
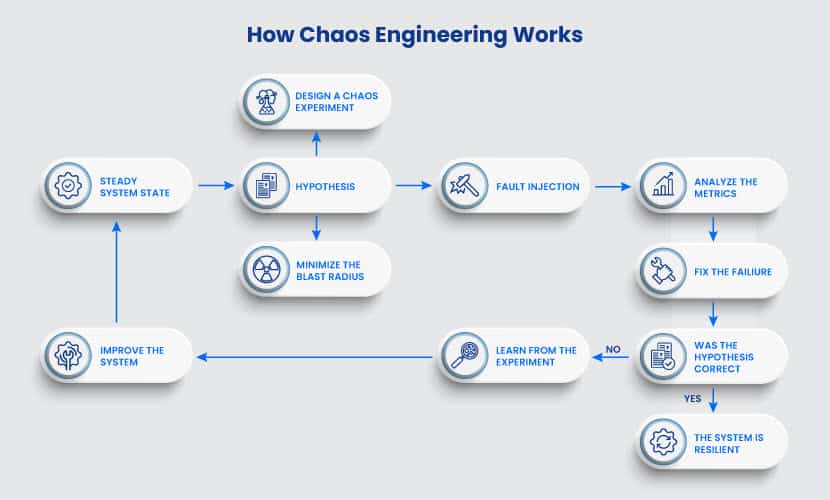
Here is a step-by-step flow of a chaos experiment:
Step 1: Creating a Hypothesis
Engineers analyze the system and choose what failure to cause. The core step of chaos engineering is to predict how the system will behave once it encounters a particular bug.
Engineers also need to determine critical metric thresholds before starting a test. Metrics typically come in two sets:
- Key metrics: These are the primary metrics of the experiment. For example, you can measure the impact on latency, requests per second, or system resources.
- Customer metrics: These are precautionary metrics that tell you if the test went too far. Examples of customer metrics are orders per minute, or stream starts per second. If a test begins impacting customer metrics, that is a sign for admins to stop experimenting.
In some tests, the two metrics can overlap.
Step 2: Fault Injection
Engineers add a specific failure to the system. Since there is no way to be sure how the application will behave, there is always a backup plan.
Most chaos engineering tools have a reverse option. That way, if something goes wrong, you can safely abort the test and return to a steady-state of the application.
Step 3: Measuring the Impact
Engineers monitor the system while the bug causes significant issues. Key metrics are the primary concern but always monitor the entire system.
If the test starts a simulated outage, the team looks for the best way to fix it.
Step 4: Verify (or Disprove) Your Hypothesis
A successful chaos test has one of two outcomes. You either verify the resilience of the system, or you find a problem you need to fix. Both are good outcomes.
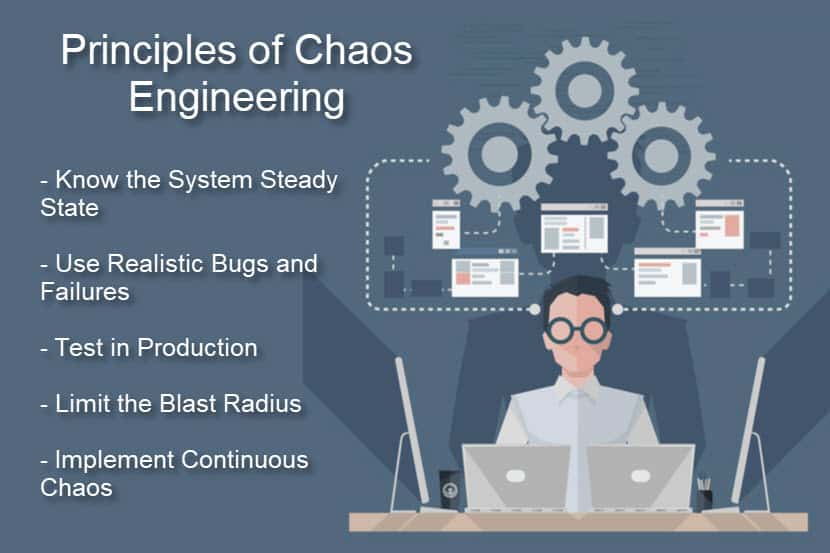
Principles of Chaos Engineering
While the name may suggest otherwise, there is nothing random in chaos engineering.
This testing method follows strict principles, which include the following principles:
Know the Normal State of Your System
Define the steady-state of your system. The usual behavior of a system is a reference point for any chaos experiment. By understanding the system when it is healthy, you will better understand the impact of bugs and failures.
Inject Realistic Bugs and Failures
All experiments should reflect realistic and likely scenarios. When you inject a real-life failure, you get a good sense of what processes and technologies need an upgrade.
Test in Production
You can only see how outages affect the system if you apply the test to a production environment.
If your team has little to no experience with chaos testing, let them start experimenting in a development environment. Test the production environment once ready.
Control the Blast Radius
Always minimize the blast radius of a chaos test. As these tests happen in a production environment, there is a chance that the test could affect end-users.
Another standard precaution is to have a team ready for actual incident response, just in case.
Continuous Chaos
You can automate chaos experiments to the same level as your CI/CD pipeline. Constant chaos allows your team to improve both current and future systems continuously.
Benefits of Chaos Engineering
The benefits of chaos engineering span across several business fronts:
Business Benefits
Chaos engineering helps stop large losses in revenue by preventing lengthy outages. The practice also allows companies to scale quickly without losing the reliability of their services.
Technical Benefits
Insights from chaos experiments reduce incidents, but that is not where technical benefits end. The team gets an increased understanding of system modes and dependencies, allowing them to build a more robust system design.
A chaos test is also excellent on-call training for the engineering team.
Customer Benefits
Fewer outages mean less disruption for end-users. Improved service availability and durability are the two chief customer benefits of chaos engineering.
Chaos Engineering Tools
These are the most common chaos engineering tools:
- Chaos Monkey: This is the original tool created at Netflix. While it came out in 2010, Chaos Monkey still gets regular updates and is the go-to chaos testing tool.
- Gremlin: Gremlin helps clients set up and control chaos testing. The free version of the tool offers basic tests, such as turning off machines and simulating high CPU load.
- Chaos Toolkit: This open-source initiative makes tests easier with an open API and a standard JSON format.
- Pumba: Pumba is a chaos testing and network emulation tool for Docker.
- Litmus: A chaos engineering tool for stateful workloads on Kubernetes.
To keep up with new tools, bookmark the diagram created by the Chaos Engineering Slack Community. Besides the tools, the chart also keeps track of known engineers working with chaos tests.
Chaos Engineering Examples
There are no limits to chaos experiments. The type of tests you run depends on the architecture of your distributed system and business goals.
Here is a list of the most common chaos tests:
- Simulating the failure of a micro-component.
- Turning a virtual machine off to see how a dependency reacts.
- Simulating a high CPU load.
- Disconnecting the system from the data center.
- Injecting latency between services.
- Randomly causing functions to throw exceptions (also known as function-based chaos).
- Adding instructions to a program and allowing fault injection (also known as code insertion).
- Disrupting syncs between system clocks.
- Emulating I/O errors.
- Causing sudden spikes in traffic.
- Injecting byzantine failures.
Chaos Engineering and DevOps
Chaos engineering is a common practice within the DevOps culture. Such tests allow DevOps to thoroughly analyze applications while keeping up with the tempo of agile development.
DevOps teams commonly use chaos testing to define a functional baseline and tolerances for infrastructure. Tests also help create better policies and processes by clarifying both steady-state and chaotic outputs.
Some companies prefer to integrate chaos engineering into their software development life cycle. Integrated chaos allows companies to ensure the reliability of every new feature.
A Must for any Large-Scale Distributed System
Continuous examination of software is vital both for application security and functionality. By proactively examining a system, you can reduce the operational burden, increase system availability, and resilience.
What is YAML? How it Works With Examples
Most formatting languages display data in a non-human readable format. Even JSON, the most popular data format in use, has poor code readability.
YAML is an alternative to JSON that formats data in a natural, easy-to-read, and concise manner.
This article will introduce you to the YAML markup language. We cover the basic concepts behind this markup language, explain its key features, and show what YAML offers to DevOps teams.
What is YAML?
YAML is a data serialization language. Back when it came out in 2001, YAML stood for “Yet Another Markup Language.” The acronym was later changed to “YAML Ain’t Markup Language” to emphasize that the language is intended for data and not documents.
It is not a programming language in the true sense of the word. YAML files store information, so they do not include actions and decisions.
Unlike XML or JSON, YAML presents data in a way that makes it easy for a human to read. The simple syntax does not impact the language’s capabilities. Any data or structure added to an XML or JSON file can also be stored in YAML.
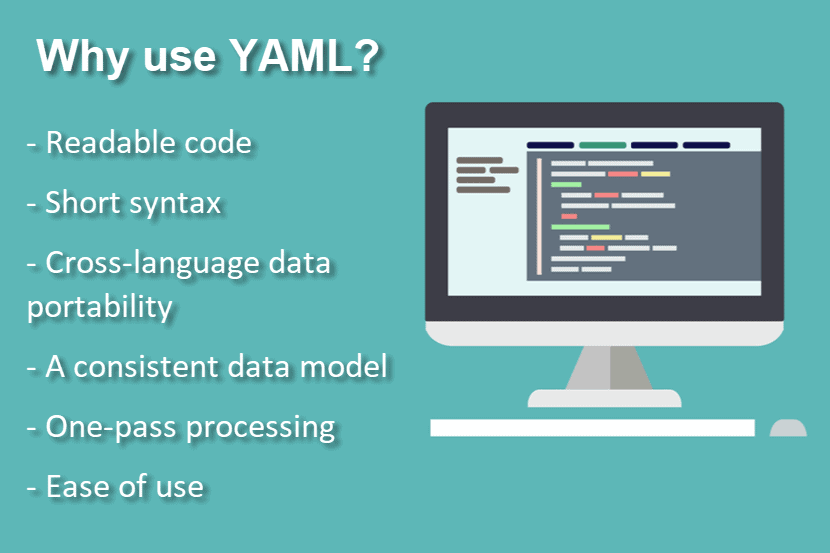
Besides human-readable code, YAML also features:
- Cross-language data portability
- A consistent data model
- One-pass processing
- Ease of implementation and use
Users can write code for reading and generating YAML in any programming language. The extensions in YAML are .yaml and .yml. Both extensions stand for the same file type.
Yaml Features
YAML has several features that make it an excellent option for data formatting.
Multi-Document Support
Users can add multiple documents to a single YAML file. Separate different documents with three dashes (---), like this:
---

time: 19:04:12

player: playerOne

action: strike (miss)

---

time: 20:03:47

player: playerTwo

action: strike (hit)

...
Three dots (“…“) mark the end of a document without starting a new one.
Built-In Comments
YAML allows users to add comments to their code. YAML comments start with the # symbol and do not have to be on a separate line:
key: #This is a single line comment

   - value line 10

   #This is a

   #multi-line comment

   - value line 20
Clean Syntax
Like Python, YAML relies on indentations to show the levels and structure in the data. There are no usual format symbols, such as braces, square brackets, closing tags, or quote marks. The syntax is clean and easy to scan through.
The clean syntax is why several popular tools rely on YAML, such as Ansible, Kubernetes, and OpenStack.
No Tabs
YAML does not allow tabs. Spaces are the only way to achieve indentation.
It is good practice to display whitespace characters in your text editor to prevent accidental uses of tabs.
Precise Feedback
YAML feedback refers to specific lines in the file. You can quickly find and fix errors when you know where to look.
Support for Complex Structures
YAML provides the ability to reference other data objects. With referencing, you can write recursive data in the YAML file and build advanced data structures.
Explicit Data Types with Tags
YAML auto-detects the type of data, but users are free to specify the type they need. To specify the type of data, you include a “!!” symbol:
# The value should be an int:

is-an-int: !!int 5.6

# Turn any value to a string:

is-a-str: !!str 90.88

# The next value should be a boolean:

is-a-bool: !!bool yes
No Executable Commands
YAML is a data-representation format. There are no executable commands, which makes the language highly secure when exchanging files with third parties.
If a user wishes to add an executable command, YAML must be integrated with other languages. Add Perl parsers, for example, to enable Perl code execution.
How YAML Works
YAML matches native data structures of agile methodology and its languages, such as Perl, Python, PHP, Ruby, and JavaScript. It also derives features from other languages:
- Scalars, lists, and arrays come from Perl.
- The three-dash separator comes from MIME.
- Whitespace wrapping comes from HTML.
- Escape sequences come from C.
YAML supports all essential data types, including nulls, numbers, strings, arrays, and maps. It recognizes some language-specific data types, such as dates, timestamps, and special numerical values.
Colon and a single space define a scalar (or a variable):
string: "17"

integer: 17

float: 17.0

boolean: No
A | character denotes a string that preserves newlines and a > character denotes a string that folds newlines:
data: |

   Every one

   Of these

   Newlines

   Will be

   Broken up.

data: >

   This text

   is wrapped

   and will

   be formed into

   a single paragraph.
Basics aside, there are two vital types of structures you need to know about in YAML:
- YAML lists
- YAML maps
Use these two structures for formatting in YAML.
YAML Maps (With Examples)
Maps associate name-value pairs, a vital aspect of setting up data. A YAML configuration file can start like this:
---

apiVersion: v3

kind: Pod
Here is the JSON equivalent of the same file opening:
{

   "apiVersion": "v3",

   "kind": "Pod"

}
Both codes have two values, v3Pod, mapped to two keys, apiVersion and kind. In YAML, the quotation marks are optional, and there are no brackets.
This markup language allows you to specify more complex structures by creating a key that maps to another map rather than a string. See the YAML example below:
---

apiVersion: v3

kind: Pod

metadata:

  name: rss-site

  labels:

    app: web
We have a key (metadata) with two other keys as its value name and labels. The labels key has another map as its value. YAML allows you to nest maps as far as you need to.
The number of spaces does not matter, but it must be consistent throughout the file. In our example, we used two spaces for readability. Name and labels have the same indentation level, so the processor knows both are part of the same map.
The same mapping would look like this in JSON:
{

  "apiVersion": "v3",

  "kind": "Pod",

  "metadata": {

               "name": "rss-site",

               "labels": {

                          "app": "web"

                         }
              }
}
YAML Lists (With Examples)
A YAML list is a sequence of items. For example:
args:

  - shutdown

  - "1000"

  - msg

  - "Restart the system"
A list may contain any number of items. An item starts with a dash, while indentation separates it from the parent. You can also store maps within a list:
---

apiVersion: v3

kind: Pod

metadata:

  name: rss-site

  labels:

    app: web

spec:

  containers:

    - name: front-end

      image: nginx

      ports:

        - containerPort: 80

    - name: rss-reader

      image: nickchase/rss-php-nginx:v1

      ports:

        - containerPort: 88
We have a list of containers (objects). Each consists of a name, an image, and a list of ports. Each item under ports is a map that lists the containerPort and its value.
Our example would look like this in JSON:
{ “apiVersion”: “v3”, “kind”: “Pod”, “metadata”: { “name”: “rss-site”, “labels”: { “app”: “web” } }, “spec”: { “containers”: [{ “name”: “front-end”, “image”: “nginx”, “ports”: [{ “containerPort”: “80” }] }, { “name”: “rss-reader”, “image”: “nickchase/rss-php-nginx:v1”, “ports”: [{ “containerPort”: “88” }] }] } }
What is the difference between YAML and JSON?
JSON and YAML are used interchangeably, and they serve the same purpose. However, there are significant differences between the two:
| YAML | JSON |
|---|---|
| Easy for a human to read | Hard for a human to read |
| Allows comments | No comments |
| Space characters determine hierarchy | Brackets and braces denote arrays and objects |
| String quotes support single and double quotes | Strings must be in double quotes |
| The root node can be any of the valid data types | The root node is either an object or an array |
The main difference between YAML and JSON is code readability. The best example of this is the official YAML homepage. That website is itself valid YAML, yet it is easy for a human to read.
YAML is a superset of JSON. If you paste JSON directly into a YAML file, it resolves the same through YAML parsers. Users can also convert most documents between the two formats. It is possible to convert JSON files into YAML either online or use a tool like Syck or XS.
YAML in IaC
YAML is a common option when writing configuration files for Infrastructure as Code. These files store parameters and settings for the desired cloud environment.
Red Hat’s Ansible, one of the most popular IaC tools, uses YAML for file management. Ansible users create so-called playbooks written in YAML code that automate manual tasks of provisioning and deploying a cloud environment.
In the example below, we define an Ansible playbook verify-apache.yml:
---

- hosts: webservers

  vars:
    http_port: 90
    max_clients: 250

  remote_user: root

  tasks:
  - name: ensure apache is at the latest version
    yum:
      name: httpd
      state: latest
  - name: write the apache config file
    template:
      src: /srv/httpd.j2
      dest: /etc/httpd.conf
    notify:
    - restart apache
  - name: ensure apache is running

    service:
      name: httpd
      state: started

  handlers:
    - name: restart apache
      service:
        name: httpd
        state: restarted
There are three tasks in this YAML playbook:
- We update Apache to the latest version using the
yumcommand. - We use a template to copy the Apache configuration file. The playbook then restarts the Apache service.
- We start the Apache service.
Once set, a playbook is run from the command line. While the path varies based on the setup, the following command runs the playbook:
ansible-playbook -i hosts/groups verify_apache.yml
The Use of YAML in DevOps
Many DevOps teams define their development pipelines using YAML. YAML allows users to approach pipeline features like a markup file and manage them as any source file. Pipelines are versioned with the code, so teams can identify issues and roll back changes quickly.
To add a YAML build definition, a developer adds a source file to the root of the repository.
Thanks to YAML, DevOps separate logic from the configuration. That way, the configuration code follows best practices, such as:
- No hard-coded strings.
- Methods that perform one function and one function only.
- Testable code.
Several tools with a prominent role in DevOps rely on YAML:
- Azure DevOps provides a YAML designer to simplify defining build and release tasks.
- Kubernetes uses YAML to create storage and lightweight Linux virtual machines.
- Docker features YAML files called Dockerfiles. Dockerfiles are blueprints for everything you need to run software, including codes, runtime, tools, settings, and libraries.
An Efficient, User-Friendly Data Formatting Language
YAML offers levels of code readability other data-formatting languages cannot deliver. YAML also allows users to perform more operations with less code, making it an ideal option for DevOps teams that wish to speed up their delivery cycles.
Pulumi vs Terraform: Comparing Key Differences
Terraform, and Pulumi are two popular Infrastructure as Code (IaC) tools used to provision and manage virtual environments. Both tools are open source, widely used, and provide similar features. However, it isn’t easy to choose between Pulumi and Terraform without a detailed comparison.
Below is an examination of the main differences between Pulumi and Terraform. The article analyzes which tool performs better in real-life use cases and offers more value to an efficient software development life cycle.
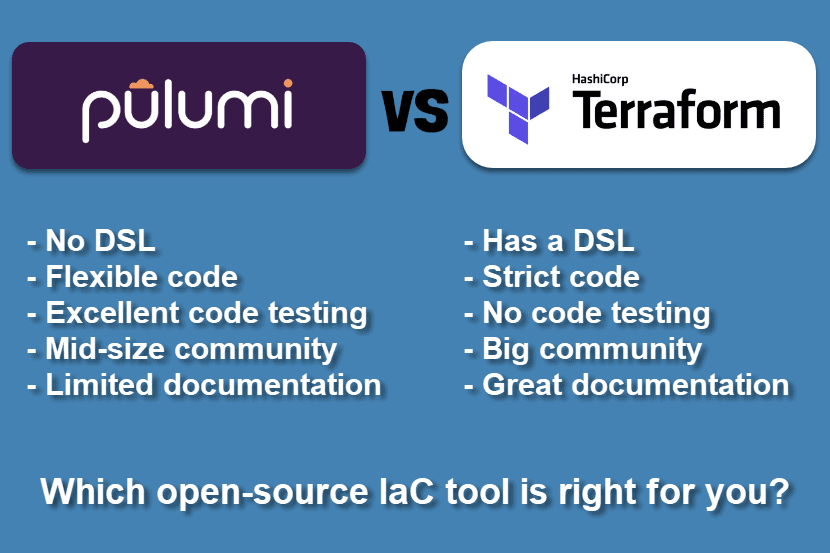
Key Differences Between Pulumi and Terraform
- Pulumi does not have a domain-specific software language. Developers can build infrastructure in Pulumi by using general-purpose languages such as Go, .NET, JavaScript, etc. Terraform, on the other hand, uses its Hashicorp Configuration Language.
- Terraform follows a strict code guideline. Pulumi is more flexible in that regard.
- Terraform is well documented and has a vibrant community. Pulumi has a smaller community and is not as documented.
- Terraform is easier for state file troubleshooting.
- Pulumi provides superior built-in testing support due to not using a domain-specific language.
What is Pulumi?
Pulumi is an open-source IaC tool for designing, deploying and managing resources on cloud infrastructure. The tool supports numerous public, private, and hybrid cloud providers, such as AWS, Azure, Google Cloud, Kubernetes, phoenixNAP Bare Metal Cloud, and OpenStack.
Pulumi is used to create traditional infrastructure elements such as virtual machines, networks, and databases. The tool is also used for designing modern cloud components, including containers, clusters, and serverless functions.
While Pulumi features imperative programming languages, use the tool for declarative IaC. The user defines the desired state of the infrastructure, and Pulumi builds up the requested resources.
What is Terraform?
Terraform is a popular open-source IaC tool for building, modifying, and versioning virtual infrastructure.
The tool is used with all major cloud providers. Terraform is used to provision everything from low-level components, such as storage and networking, to high-end resources such as DNS entries. Building environments with Terraform is user-friendly and efficient. Users can also manage multi-cloud or multi offering environments with this tool.
How to Install Terraform?
Learn how to get started with Terraform in our guide How to Install Terraform on CentOS/Ubuntu.
Terraform is a declarative IaC tool. Users write configuration files to describe the needed components to Terraform. The tool then generates a plan describing the required steps to reach the desired state. If the user agrees with the outline, Terraform executes the configuration and builds the desired infrastructure.
Pulumi vs Terraform Comparison
While both tools serve the same purpose, Pulumi and Terraform differ in several ways. Here are the most prominent differences between the two infrastructure as code tools:
1. Unlike Terraform, Pulumi Does Not Have a DSL
To use Terraform, a developer must learn a domain-specific language (DSL) called Hashicorp Configuration Language (HCL). HCL has the reputation of being easy to start with but hard to master.
In contrast, Pulumi allows developers to use general-purpose languages such as JavaScript, TypeScript, .Net, Python, and Go. Familiar languages allow familiar constructs, such as for loops, functions, and classes. All these functionalities are available with HCL too, but their use requires workarounds that complicate the syntax.
The lack of a domain-specific language is the main selling point of Pulumi. By allowing users to stick with what they know, Pulumi cuts down on boilerplate code and encourages the best programming practices.
2. Different Types of State Management
With Terraform, state files are by default stored on the local hard drive in the terraform.tfstate file. With Pulumi, users sign up for a free account on the official website, and state files are stored online.
By enabling users to store state files via a free account, Pulumi offers many functionalities. There is a detailed overview of all resources, and users have insight into their deployment history. Each deployment provides an analysis of configuration details. These features enable efficient managing, viewing, and monitoring activities.
What's a State File?
State files help IaC tools map out the configuration requirements to real-world resources.
To enjoy similar benefits with Terraform, you must move away from the default local hard drive setup. To do that, use a Terraform Cloud account or rely on a third-party cloud storing provider. Small teams of up to five users can get a free version of Terraform Cloud.
Pulumi requires a paid account for any setup with more than a single developer. Pulumi’s paid version offers additional benefits. These include team sharing capabilities, Git and Slack integrations, and support for features that integrate the IaC tool into CI/CD deployments. The team account also enables state locking mechanisms.
3. Pulumi Offers More Code Versatility
Once the infrastructure is defined, Terraform guides users to the desired declarative configuration. The code is always clean and short. Problems arise when you try to implement certain conditional situations as HCL is limited in that regard.
Pulumi allows users to write code with a standard programming language, so numerous methods are available for reaching the desired parameters.
4. Terraform is Better at Structuring Large Projects
Terraform allows users to split projects into multiple files and modules to create reusable components. Terraform also enables developers to reuse code files for different environments and purposes.
Pulumi structures the infrastructure as either a monolithic project or micro-projects. Different stacks act as different environments. When using higher-level Pulumi extensions that map to multiple resources, there is no way to deserialize the stack references back into resources.
5. Terraform Provides Better State File Troubleshooting
When using an IaC tool, running into a corrupt or inconsistent state is inevitable. A crash usually causes an inconsistent state during an update, a bug, or a drift caused by a bad manual change.
Terraform provides several commands for dealing with a corrupt or inconsistent state:
refreshhandles drift by adjusting the known state with the real infrastructure state.state {rm,mv}is used to modify the state file manually.importfinds an existing cloud resource and imports it into your state.taint/untaintmarks individual resources as requiring recreation.
Pulumi also offers several CLI commands in the case of a corrupt or inconsistent state:
refreshworks in the same way as Terraform’s refresh.state deleteremoves the resource from the state file.
Pulumi has no equivalent of taint/untaint. For any failed update, a user needs to edit the state file manually.
6. Pulumi Offers Better Built-In Testing
As Pulumi uses common programming languages, the tool supports unit tests with any framework supported by the user’s software language of choice. For integrations, Pulumi only supports writing tests in Go.
Terraform does not offer official testing support. To test an IaC environment, users must rely on third-party libraries like Terratest and Kitchen-Terraform.
7. Terraform Has Better Documentation and a Bigger Community
When compared to Terraform, the official Pulumi documentation is still limited. The best resources for the tool are the examples found on GitHub and the Pulumi Slack.
The size of the community also plays a significant role in terms of helpful resources. Terraform has been a widely used IaC tool for years, so its community grew with its popularity. Pulumi‘s community is still nowhere close to that size.
8. Deploying to the Cloud
Pulumi allows users to deploy resources to the cloud from a local device. By default, Terraform requires the use of its SaaS platform to deploy components to the cloud.
If a user wishes to deploy from a local device with Terraform, AWS_ACCESS_KEY and AWS_SECRET_ACCESS_KEY variables need to be added to the Terraform Cloud environment. This process is not a natural fit with federated SSO accounts for Amazon Web Services (AWS). Security concerns over a third-party system having access to your cloud are also worth noting.
The common workaround is to use Terraform Cloud solely for storing state information. This option, however, comes at the expense of other Terraform Cloud features.
Note: The table is scrollable horizontally!
| Pulumi | Terraform | |
|---|---|---|
| Publisher | Pulumi | HashiCorp |
| Method | Push | Push |
| IaC approach | Declarative | Declarative |
| Price | Free for one user, three paid packages for teams | Free for up to five users, two paid packages for larger teams |
| Written in | Typescript, Python, Go | Go |
| Source | Open | Open |
| Domain-Specific Language (DSL) | No | Yes (Hashicorp Configuration Language) |
| Main advantage | Code in a familiar programming language, great out-of-the-box GUI | Pure declarative IaC tool, works with all major cloud providers, lets you create infrastructure building blocks |
| Main disadvantage | Still unpolished, documentation lacking in places | HCL limits coding freedom and needs to be mastered to use advanced features |
| State files management | State files are stored via a free account | State files are by default stored on a local hard drive |
| Community | Mid-size | Large |
| Ease of use | The use of JavaScript, TypeScript, .Net, Python, and Go keeps IaC familiar | HCL is a complex language, albeit with a clean syntax |
| Modularity | Problematic with higher-level Pulumi extensions | Ideal due to reusable components |
| Documentation | Limited, with best resources found on Pulumi Slack and GitHub | Excellent official documentation |
| Code versatility | As users write code in different languages, there are multiple ways to reach the desired state | HCL leaves little room for versatility |
| Deploying to the cloud | Can be done from a local device | Must be done through the SaaS platform |
| Testing | Test with any framework that supports the used programming language | Must be performed via third-party tools |
Using Pulumi and Terraform Together
It is possible to run IaC by using both Pulumi and Terraform at the same time. Using both tools requires some workarounds, though.
Pulumi supports consuming local or remote Terraform state from Pulumi programs. This support helps with the gradual adoption of Pulumi if you decide to continue managing a subset of your virtual infrastructure with Terraform.
For example, you might decide to keep your VPC and low-level network definitions written in Terraform to avoid disrupting the infrastructure. Using the state reference support, you can design high-level infrastructure with Pulumi and still consume the Terraform-powered VPC information. In that case, the co-existence of Pulumi and Terraform is easy to manage and automate.
Conclusion: Both are Great Infrastructure as Code Tools
Both Terraform and Pulumi offer similar functionalities. Pulumi is a less rigid tool focused on functionality. Terraform is more mature, better documented, and has strong community support.
However, what sets Pulumi apart is its fit with the DevOps culture.
By expressing infrastructure with popular programming languages, Pulumi bridges the gap between Dev and Ops. It provides a common language between development and operations teams. In contrast, Terraform reinforces silos across departments, pushing development and operations teams further apart with its domain-specific language.
From that point of view, Pulumi is a better fit for standardizing the DevOps pipeline across the development life cycle. The tool reinforces uniformity and leads to quicker software development with less room for error.

What Is Infrastructure as Code? Benefits, Best Practices, & Tools
Infrastructure as Code (IaC) enables developers to provision IT environments with several lines of code. Unlike manual infrastructure setups that require hours or even days to configure, it takes minutes to deploy an IaC system.
This article explains the concepts behind Infrastructure as Code. You will learn how IaC works and how automatic configurations enable teams to develop software with higher speed and reduced cost.
What is Infrastructure as Code (IaC)?
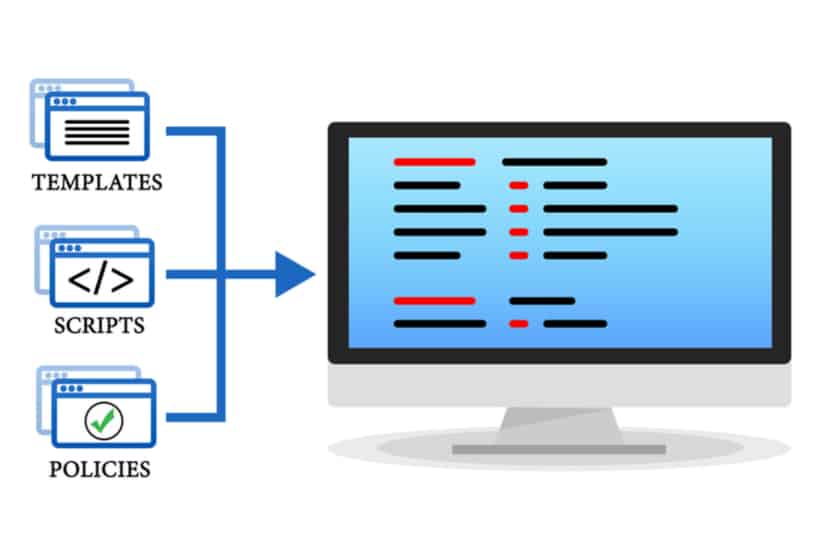
Infrastructure as Code is the process of provisioning and configuring an environment through code instead of manually setting up the required devices and systems. Once code parameters are defined, developers run scripts, and the IaC platform builds the cloud infrastructure automatically.
Such automatic IT setups enable teams to quickly create the desired cloud setting to test and run their software. Infrastructure as Code allows developers to generate any infrastructure component they need, including networks, load balancers, databases, virtual machines, and connection types.
How Infrastructure as Code WorkS
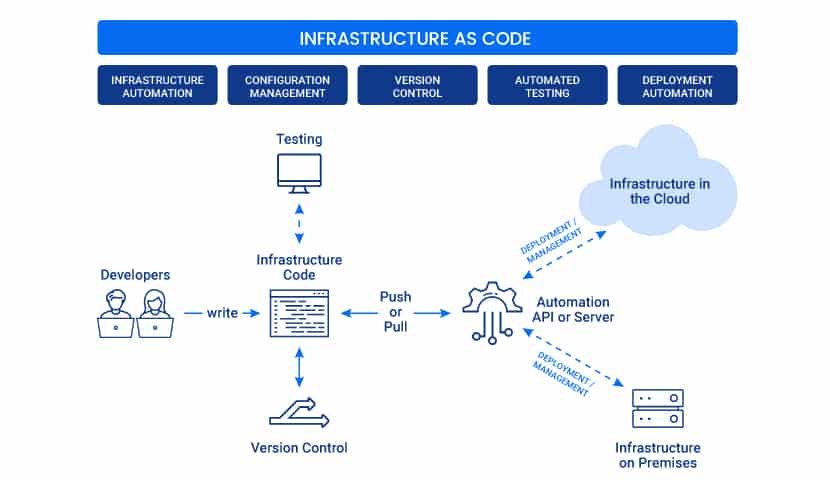
Here is a step-by-step explanation of how creating an IaC environment works:
- A developer defines the configuration parameters in a domain-specific language (DCL).
- The instruction files are sent to a master server, a management API, or a code repository.
- The IaC platform follows the developer’s instructions to create and configure the infrastructure.
With IaC, users don’t need to configure an environment every time they want to develop, test, or deploy software. All infrastructure parameters are saved in the form of files called manifests.
As all code files, manifests are easy to reuse, edit, copy, and share. Manifests make building, testing, staging, and deploying infrastructure quicker and consistent.
Developers codify the configuration files store them in version control. If someone edits a file, pull requests and code review workflows can check the correctness of the changes.
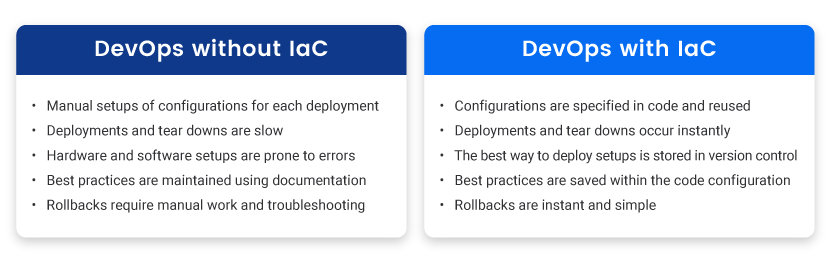
What Issues Does Infrastructure as Code Solve?
Infrastructure as Code solves the three main issues of manual setups:
- High price
- Slow installs
- Environment inconsistencies
High Price
Manually setting up each IT environment is expensive. You need dedicated engineers for setting up the hardware and software. Network and hardware technicians require supervisors, so there is more management overhead.
With Infrastructure as Code, a centrally managed tool sets up an environment. You pay only for the resources you consume, and you can quickly scale up and down your resources.
Slow Installs
To manually set up an infrastructure, engineers first need to rack the servers. They then manually configure the hardware and network to the desired settings. Only then can engineers start to meet the requirements of the operating system and the hosted application.
This process is time-consuming and prone to mistakes. IaC reduces the setup time to minutes and automates the process.
Environment Inconsistencies
Whenever several people are manually deploying configurations, inconsistencies are bound to occur. Over time, it gets difficult to track and reproduce the same environments. These inconsistencies lead to critical differences between development, QA, and production environments. Ultimately, the differences in settings inevitably cause deployment issues.
Infrastructure as Code ensures continuity as environments are provisioned and configured automatically with no room for human error.
The Role of Infrastructure as Code in DevOps
Infrastructure as Code is essential to DevOps. Agile processes and automation are possible only if there is a readily available IT infrastructure to run and test the code.
With IaC, DevOps teams enjoy better testing, shorter recovery times, and more predictable deployments. These factors are vital for quick-paced software delivery. Uniform IT environments lower the chances of bugs arising in the DevOps pipeline.
The IaC approach has no limitations as DevOps teams provision all aspects of the needed infrastructure. Engineers create servers, deploy operating systems, containers, application configurations, set up data storage, networks, and component integrations.
IaC can also be integrated with CI/CD tools. With the right setup, the code can automatically move app versions from one environment to another for testing purposes.
Benefits of Infrastructure as Code
Here are the benefits an organization gets from Infrastructure as Code:
Speed
With IaC, teams quickly provision and configure infrastructure for development, testing, and production. Quick setups speed up the entire software development lifecycle.
The response rate to customer feedback is also faster. Developers add new features quickly without needing to wait for more resources. Quick turnarounds to user requests improve customer satisfaction.
Standardization
Developers get to rely on system uniformity during the delivery process. There are no configuration drifts, a situation in which different servers develop unique settings due to frequent manual updates. Drifts lead to issues at deployment and security concerns.
IaC prevents configuration drifts by provisioning the same environment every time you run the same manifest.
Reusability
DevOps teams can reuse existing IaC scripts in various environments. There is no need to start from scratch every time you need new infrastructure.
Collaboration
Version control allows multiple people to collaborate on the same environment. Thanks to version control, developers work on different infrastructure sections and roll out changes in a controlled manner.
Efficiency
Infrastructure as Code improves efficiency and productivity across the development lifecycle.
Programmers create sandbox environments to develop in isolation. Operations can quickly provision infrastructure for security tests. QA engineers have perfect copies of the production environments during testing. When it is deployment time, developers push both infrastructure and code to production in one step.
IaC also keeps track of all environment build-up commands in a repository. You can quickly go back to a previous instance or redeploy an environment if you run into a problem.
Lower Cost
IaC reduces the costs of developing software. There is no need to spend resources on setting up environments manually.
Most IaC platforms offer a consumption-based cost structure. You only pay for the resources you are actively using, so there is no unnecessary overhead.
Scalability
IaC makes it easy to add resources to existing infrastructure. Upgrades are provisioned quickly, and with ease, so you can quickly expand during burst periods.
For example, organizations running online services can easily scale up to keep up with user demands.
Disaster Recovery
In the event of a disaster, it is easy to recover large systems quickly with IaC. You just re-run the same manifest, and the system will be back online at a different location if need be.

Infrastructure as Code Best Practices
Use Little to No Documentation
Define specifications and parameters in configuration files. There is no need for additional documentation that gets out of sync with the configurations in use.
Version Control All Configuration Files
Place all your configuration files under source control. Versioning gives flexibility and transparency when managing infrastructure. It also allows you to track, manage, and restore previous manifests.
Constantly Test the Configurations
Test and monitor environments before pushing any changes to production. To save time, consider setting up automated tests to run whenever the configuration code gets modified.
Go Modular
Divide your infrastructure into multiple components and then combine them through automation. IaC segmentation offers many advantages. You control who has access to certain parts of your code. You also limit the number of changes that can be made to manifests.
Infrastructure as Code Tools
IaC tools speed up and automate the provisioning of cloud environments. Most tools also monitor previously created systems and roll back changes to the code.
While they vary in terms of features, there are two main types of Infrastructure as Code tools:
- Imperative tools
- Declarative tools
Imperative Approach Tools
Tools with an imperative approach define commands to enable the infrastructure to reach the desired state. Engineers create scripts that provision the infrastructure one step at a time. It is up to the user to determine the optimal deployment process.
The imperative approach is also known as the procedural approach.
When compared to declarative approach tools, imperative IaC requires more manual work. More tasks are required to keep scripts up to date.
Imperative tools are a better fit with system admins who have a background in scripting.
const aws = require("@pulumi/aws");
let size = "t2.micro";
let ami = "ami-0ff8a91507f77f867"
let group = new aws.ec2.SecurityGroup("webserver-secgrp", {
ingress: [
{protocol: "tcp", fromPort: 22, toPort: 22, cidrBlocks: ["0.0.0.0/0"] },
],
});
let server = new aws.ec2.Instance("webserver-www", {
instanceType: size,
securityGroups: [ group.name ],
ami: ami,
});
exports.publicIp = server.publicIp;
exports.publicHostName= server.publicDns;
Imperative IaC example (using Pulumi)
Declarative Approach Tools
A declarative approach describes the desired state of the infrastructure without listing the steps to reach that state. The IaC tool processes the requirements and then automatically configures the necessary software.
While no step-by-step instruction is needed, the declarative approach requires a skilled administrator to set up and manage the environment.
Declarative tools are catered towards users with strong programming experience.
resource "aws_instance" "myEC2" {
ami = "ami-0ff8a91507f77f867"
instance_type = "t2.micro"
security_groups = ["sg-1234567"]
}
Declarative Infrastructure as Code example (using Terraform)
Popular IaC Tools
The most widely used Infrastructure as Code tools on the market include:
- Terraform: This open-source declarative tool offers pre-written modules that you populate with parameters to build and manage an infrastructure.
- Pulumi: The main advantage of Pulumi is that users can rely on their favorite language to describe the desired infrastructure.
- Puppet: Using Puppet’s Ruby-based DSL, you define the desired state of the infrastructure, and the tool automatically creates the environment.
- Ansible: Ansible enables you to model the infrastructure by describing how the components and systems relate to one another.
- Chef: Chef is the most popular imperative tool on the market. Chef allows users to make “recipes” and “cookbooks” using its Ruby-based DSL. These files specify the exact steps needed to achieve the desired environment.
- SaltStack: What sets SaltStack apart is the simplicity of provisioning and configuring infrastructure components.
Learn more about Pulumi in our article What is Pulumi?.
To see how different options tools stack up, read Ansible vs. Terraform vs. Puppet.
Want to Stay Competitive, IaC is Not Optional
Infrastructure as Code is an effective way to keep up with the rapid pace of current software development. In a time when IT environments must be built, changed, and torn down daily, IaC is a requirement for any team wishing to stay competitive.
PhoenixNAP’s Bare Metal Cloud platform supports API driven provisioning of servers. It’s also fully integrated with Ansible and Terraform, two of the leading Infrastructure as Code tools.
Learn more about Bare Metal Cloud and how it can help propel an organization’s Infrastructure as Code efforts.
DevOps vs Agile: Differences + Head to Head Comparison
The evolution of software development has three significant milestones. First was introducing the waterfall method that focused on the time required to release a product. Then came the agile methodology which optimized the development life-cycle.
Now, DevOps seeks to unite development and operations to work together as a single team. It increases productivity, improves collaboration, and delivers superior products.
Adopting agile and DevOps practices in software development presents a challenge to many. The first step to overcoming this obstacle is understanding the difference between agile and DevOps and the role these development methodologies play.
Key Differences Between Agile and DevOps
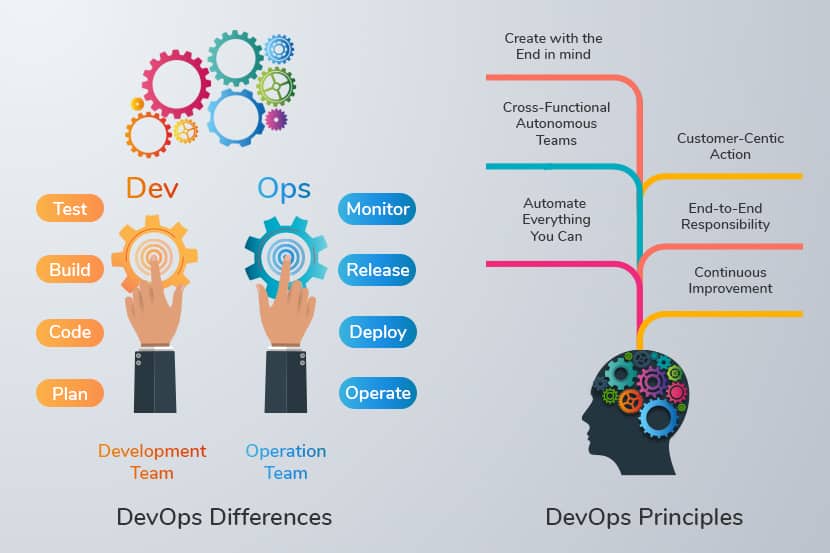
- Agile focuses on cross-functional team communication and deploying constant iterative releases. DevOps focuses on uniting the Development and Operations teams in a continuous development process.
- Agile focuses on embracing mid-project changes. DevOps focuses on the end-to-end software engineering process that embraces constant development and testing.
- Agile advocates making incremental deployments after each sprint. DevOps aims to introduce continuous delivery daily.
- In Agile, teams have similar skill-sets. In DevOps, team members have diverse skill-sets.
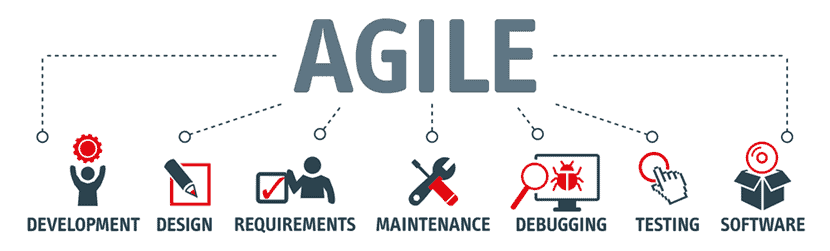
What is Agile?
Agile is a methodology that focuses on continuously delivering small manageable increments of a project through iterative development and testing. It was introduced as an alternative to the traditional waterfall methodology, known for its structured, linear, sequential life-cycle.
Dynamic processes such as project management and software development require the ability to adapt to changes and new conditions. The inflexible waterfall approach couldn’t meet the expectations of the fast-paced world of continuous technological innovation. Thus, agile was born.
Agile provides effective, day-to-day management of complex projects, improving communication and collaboration among team members and customers.
Agile Values
The methodology is defined by the Agile Manifesto, 12 principles that lay the foundation and values of “working agile.”
There are four core values at the heart of agile software development:
Individuals and interactions over processes and tools. The manifesto emphasizes the importance of valuing each team member and fostering a healthy and stimulating work environment. To maximize efficiency, it encourages constant communication between teammates, so everyone is involved in the development process.
Working software over comprehensive documentation. Documentation cannot stand in the way of delivering software. Previously, every project had to start with detailed documentation of the requirements and expectations of the developing software. Agile is focused on embarrassing changes and avoids spending too much time on documentation that will probably get altered later.
Customer collaboration over contract negotiation. Continuous development involves collaborating with the customer regularly. Immediate feedback guides the project in the direction which will eventually give the best results. Negotiating a contract with the customer before development and referring back to it after production leads to potential miscommunication. It should be avoided.
Responding to change over following a plan. Changes made mid-project need to be readily accepted as they can help with the product’s overall success. Adapting to new circumstances and embracing new features is one of the prominent differences between agile and waterfall.
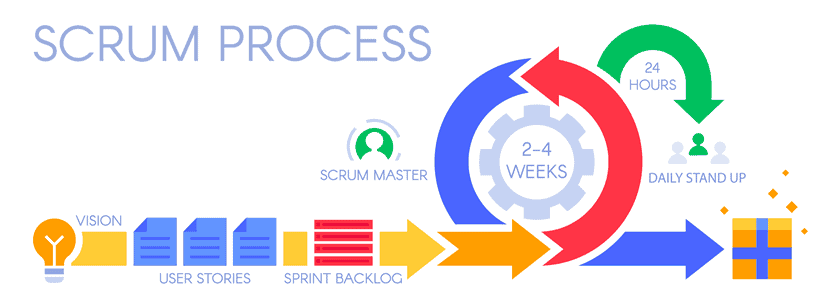
Agile Software Development
Agile software development involves implementing agile frameworks, such as Scrum and Kanban. Each software development life-cycle starts with breaking up the project into manageable stories and requirements. The tasks are organized into sprints. A sprint takes place over two weeks, during which the team works on getting a specific feature up and running.
During the sprint, the team focuses on building, testing, and deploying software, making adjustments along the way. Once they complete a sprint, they move on to the next, until the project is complete. Such a practice allows continuous delivery of software. At the same time, customers, stakeholders, and project managers can follow and give feedback to ensure satisfactory results.
Some development stages can also include automated processes to speed up integration (such as automation testing and code management) and ensure everything is working correctly.
During development, the team collaborates, gives each other feedback, and reviews their work after each sprint, during regular retrospective sessions.
What is DevOps?
DevOps is a software development culture in which the development team and operations team work together to improve collaboration and productivity. The practice also involves implementing DevOps principles and practices and using a set of DevOps tools for testing.
DevOps principles foster communication, end-to-end responsibility, and information sharing. They define DevOps and set their goals.
Unlike traditional software development, DevOps consists of a continuous cycle of building, testing, deploying, and monitoring software. DevOps’ main objective is to deliver quality software efficiently.
DevOps Principles
More and more companies are transitioning to DevOps. Implementing DevOps has many advantages, such as fast and easily integrated software deployments.
The transition to this new culture is impossible without understanding the fundamental values that drive it. It requires a change of mindset within the development and the operations team, which inspires them to work as a united front.
The following principles are the foundation that steers the engineering process in a DevOps environment:
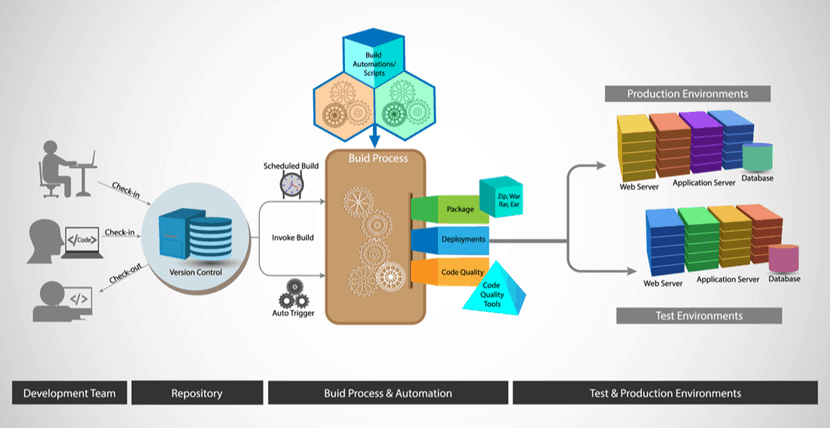
Version Control. Developers submit code changes to a central repository several times a day. Prior to submitting code to the master repository (master branch), all code must be verified. To facilitate collaboration, other developers can track changes.
Continuous Integration. Members of the development team integrate their code in a shared repository, several times a day. Each developer segments the work into small, manageable chunks of code and detects potential merge conflicts and bugs quicker.
Continuous Delivery. As the code is continuously integrated, it is also consistently delivered to the end-user. Smaller contributions allow faster update releases, which is a crucial factor for customer satisfaction.
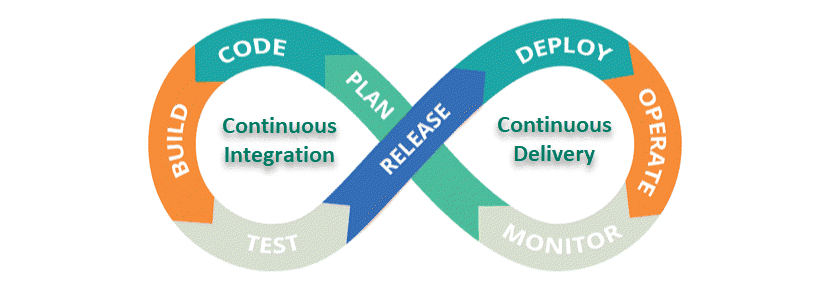
Continuous Deployment. A big part of DevOps is automating processes to speed up production. Continuous deployment involves automating releases of minor updates that do not pose a substantial threat to the existing architecture.
Continuous Testing. Such a strategy involves testing as much as possible in every step of development. Automated tests give valuable feedback and a risk assessment of the process at hand.
Continuous Operations. The DevOps team is always working on upgrading software with small but frequent releases. That is why DevOps requires constant monitoring of performance. Its main goal is to prevent downtime and availability issues during code release.
Collaboration. One of the main goals of DevOps is to foster collaboration and feedback sharing. Development and Operations need to proactively communicate and share feedback to maintain an efficient DevOps pipeline.
For a detailed overview of DevOps principles and practices, read 9 Key DevOps Principles.
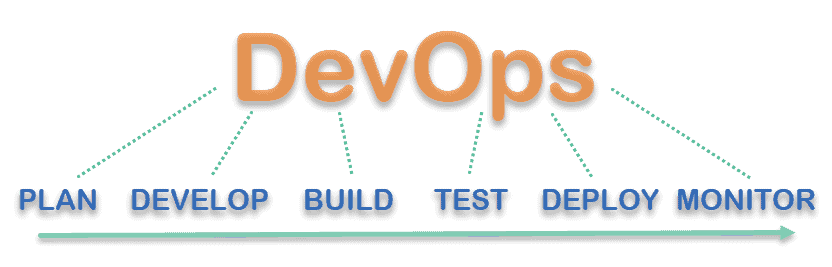
DevOps Software Development
DevOps software development focuses on an established pipeline the project has to pass through. The number of stages depends on the complexity and type of software the team is developing. The key stages include developing, building, testing, and deploying.
A planning stage often precedes all the previously mentioned, and a monitoring stage is also added after deployment.
For more information about DevOps software development stages and how to plan a DevOps pipeline, check out What is DevOps Pipeline & How to Build One.
Agile vs. DevOps
| Agile | DevOps | |
| Basic Philosophy | A culture that focuses on continuously delivering small manageable increments of a project through iterative development and testing. | A practice in which the development and operations team work together is integrated to improve collaboration and productivity. |
| Use | It can be utilized in any department to help manage a complex project. | Focuses on the end-to-end engineering process. |
| Focus | Creating an environment that welcomes mid-project changes to improve quality. | Merging development and operations teams to ensure they practice continual testing and development. |
| Team | Smaller in number, team members work closely together and have similar skill sets. | A wide variety of skill sets inside a larger team which consists of multiple departments. |
| Delivery | Incremental deployments after each sprint (usually a weekly or biweekly period). | The goal is to provide continuous delivery daily (or even every few hours). |
| Documentation | Extremely light documentation to enhance flexibility in the development process. | Sufficient documentation to ensure the teams collaborate well. Emphasizing communication over official documentation. |
| Quality and Risk | The quality of the product increases, while the risk decreases after every sprint. | Production of high-quality products with low risk due to effective collaboration and automated testing. |
| Feedback | Focuses on customer feedback and adjusts the product accordingly. | Encourages internal feedback among teammates to improve and speed up delivery. |
| Tools | Kanboard, JIRA, Active Collab, Bugzilla, Slack, Trello. | TeamCity, AWS, Puppet, OpenStack, Docker, Jenkins, Kubernetes, GitLab. |
Merging Agile and DevOps
There are many advantages to merging agile and DevOps. Including, speeding up delivery, higher user satisfaction, and effective collaboration within a team.
Combining the practices of DevOps with the culture of agile requires changing existing strategies and attitudes.
Understanding. The agile methodology requires team members to understand each other’s tasks. Mutual understanding is especially important for Scrum Masters, Project Managers, and Product Owners. To successfully manage a project, they need to know every step required to deliver the product.
Collaboration. DevOps involves the development team working together with the operations team. The previously mentioned roles now need to understand all aspects of the development process and operations.
DevOps practices in sprints. Next, the team needs to adopt integrating DevOps while handling sprints. That involves including the entire DevOps team (along with QA) in planning, daily standups, and retrospections.
Automate workflows. As automation is an essential part of DevOps development, it should be included in the agile workflow and project planning. Emerging fields, such as AIOps, use artificial intelligence to automate manual workflows in the IT environment.
Measure success. Merging agile and DevOps also involves assessing and measuring key DevOps metrics and KPIs within end-to-end development.
DevOps and Agile Can Work Together
Agile and DevOps both aim towards delivering quality software in a timely manner. The difference between agile and DevOps is that agile focuses on optimizing the development life-cycle, while DevOps unites development and operations in a CI/CD environment.
DevOps and agile are not mutually exclusive. Any organization transitioning to DevOps should not abandon existing agile workflows. DevOps is an extension of agile built around the practices that are not in agile’s focus. When used together, both practices improve software development and lead to better products.

9 Key DevOps Principles: Practices Your Team Needs to Adopt
DevOps is a set of principles that Development and Operations teams implement to deliver high-quality software in record time.
In Agile, Dev and Ops teams worked separately in silos, which negatively impacted the organization’s overall productivity. DevOps solves that problem by uniting Development and Operations into one group tasked with working together to achieve common objectives.
In this article, learn nine crucial Devops principles and practices and how implementing them can help your organization get the most out of DevOps.
What is DevOps?
DevOps is a software development culture that unites development, operations, and quality assurance processes into a continuous set of actions. It facilitates cross-functional communication, end-to-end responsibility, and collaboration, and is a natural extension of the Agile methodology.
Transitioning to DevOps does not require any technical innovation. It depends on adopting the right DevOps principles, values, and adapting them to your organization’s needs.
DevOps Principles
DevOps is a mindset or a philosophy that encompasses collaboration, communication, sharing, openness, and a holistic approach to software development.
DevOps relies on a comprehensive set of strategies and methodologies. They ensure the timely delivery of quality software. DevOps principles guide how to organize a DevOps environment.
1. Incremental Releases
Before DevOps, teams had to wait their turn to deploy code. A delay in code release often caused bottlenecks or what is known as “merge hell.” When developers have to wait for a prolonged period of time to contribute code, errors, and incompatibility issues are inevitable.
DevOps encourages developers to contribute new code as often as possible, usually many times during the day. In a DevOps environment, a single project is divided into small, manageable chunks, and teams submit their code in increments. That makes it easier to troubleshoot problematic code before it gets released to production. Depending on the workflow, DevOps teams release code updates and bug fixes on a daily, weekly, or monthly basis.
Incremental releases make the development and deployment cycle more flexible. As a result, teams can quickly respond to sudden changes and fix errors and bugs immediately. The primary goal is to prevent bad code from being deployed to the end-user.
2. Automation
One of the critical practices of DevOps is automating as much of the software development process as possible. Automating workflows allows developers to focus solely on writing code and developing new features.
Anything that can be automated should be automated in a DevOps environment. For example, instead of wasting time on manually checking code for errors, DevOps teams use different software solutions to build and test applications automatically. It is as simple as running a single command to compile the source code to determine if it will work in production.
If the application is written in a language that doesn’t need to be compiled, DevOps teams can run automated tests to check if the new code is production-ready. If there are any errors or bugs in the code, automation will trigger an alert letting developers know which lines of code are causing issues.
Read how Artificial Intelligence is automating IT Operations workflows in our article What is AIOps.
Automation also plays a vital role in dealing with infrastructure management procedures.
In a DevOps environment, teams utilize Infrastructure-as-Code (IaC). Infrastructure-automation software, such as Pulumi, helps manage the provisioning and decommissioning of resources. It involves utilizing scripts, APIs, and CLIs to manage infrastructure as code rather than doing everything manually.
The goal is to enable developers to quickly provision anything from containers and virtual machines to bare metal cloud servers, storage, databases, and other infrastructure.
Infrastructure-as-Code (IaC). IaC made it possible for enterprises to deploy hundreds of servers or applications every day and destroy them when they are not needed. By letting automation take care of infrastructure management procedures, teams can focus their efforts on building and deploying software.
3. DevOps Pipeline
DevOps aims to establish a repeatable system, a loop that facilitates continuity in development. To achieve that, DevOps teams create pipelines.
A pipeline denotes a repeatable system made up of stages through which code has to pass before being deployed to production. A typical DevOps pipeline consists of four primary phases:
- Develop. First, the developers have to write the code.
- Build. Then, the team compiles the code into a build to check for errors.
- Test. After the build phase, operations teams run tests to ensure that the new code will behave as intended in the production environment.
- Deploy. Once the new code has passed the testing phase, it gets deployed to the end-user.
Learn what a DevOps pipeline is and how to create one.
DevOps teams implement critical strategies to achieve a steady flow of code through the pipeline. The most important among them is Continuous Integration (CI) and Continuous Delivery (CD), also known as CI/CD.
Continuous Integration has to do with enabling multiple developers to submit and merge their code regularly, while Continuous Delivery is all about releasing code updates to production as often as possible.
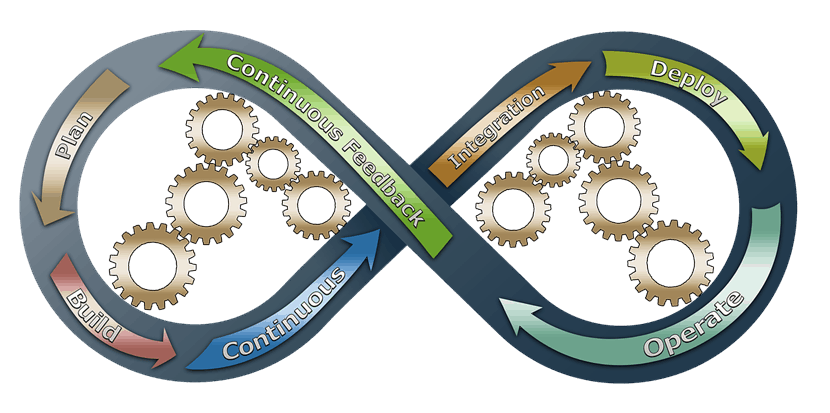
In that regard, “continuous everything” is a DevOps principle that has to do with creating a never-ending development and deployment pipeline.
Along with CI/CD, in professional DevOps environments, teams strive to ensure continuity in every aspect of the pipeline – monitoring, feedback gathering, and deployments.
4. Continuous Integration
Continuous Integration (CI) plays a pivotal role in a DevOps pipeline. It encourages developers to submit their code to a central code repository multiple times a day.
By integrating smaller chunks of code regularly, the likelihood of bad code moving down the pipeline and causing service interruptions is significantly reduced. Some of the largest organizations that implement DevOps practices commit new code hundreds of times a day.
Another critical aspect of Continuous Integration is automated testing. Before developers commit their code to the master branch, they create builds of the project to determine if the new code is compatible with the existing code. If the build is successful, developers will submit their code to the shared repository. CI relies on a version control system, a central code repository that helps teams track code changes and manage merge requests.
5. Continuous Delivery
Continuous Delivery (CD) is all about releasing code updates frequently and fast. CD relies on developers to manually deploy code to production as opposed to Continuous Deployment, which takes an automated approach to code release. For CD to yield positive results, it’s paramount to create a repeatable system that will push the code through the DevOps pipeline.
Developers working in a CD environment need to keep in mind that their code contributions may get deployed to production at any moment. Having passed all tests and reviews, code updates can be released to production with a click of a button.
Numerous benefits come with continuous delivery. First, it eliminates the risk of downtime and other performance issues because code changes are usually minor. Second, CD enables organizations to release high-quality features much easier, ensuring faster time-to-market, and ultimately eliminating fixed costs associated with the deployment process.

Quality Assurance teams set a committed code test using automation testing tools such as UFT, Ranorex, or Selenium. If QA finds vulnerabilities or bugs, they go back to the engineers. This stage features version control to look for any integration problem in advance. The Version Control System allows developers to record the changes in the files for sharing with other team members, regardless of location.
Codes that pass automated tests get integrated into one shared repository. Several code submissions serve to prevent future drastic differences in code branch and mainline code, lengthening integration. Popular continuous integration tools include GitLab CI, Jenkins, TeamCity, and Bamboo.
DevOps tools help engineers deploy a product in increments, such as Puppet, Chef, Google Cloud Deployment Manager, and Azure Resource Manager.
6. Continuous Monitoring
Continuous Monitoring builds on the concepts of CI/CD, and it ensures the application performs without issues. DevOps teams implement monitoring technologies and techniques to keep track of how the application is behaving.
DevOps teams monitor logs, apps, systems, and infrastructure. Once a problem is detected, DevOps teams can quickly revert the app to a previous state. During that time, the team works on resolving known issues without making the user aware that the code is updated continuously.
Continuous monitoring also helps DevOps teams detect issues that are hindering productivity in the pipeline. After each release cycle, teams should optimize the CI/CD pipeline to eliminate any bottlenecks and ensure a smooth transition of code from one stage to the next.
Peter Borg, SCRUM Master at phoenixNAP, shared his experience on transitioning to DevOps.
7. Feedback Sharing
DevOps thrives on feedback. Developers need actionable information from different sources to help them improve the overall quality of the application. Without feedback, DevOps teams can fall victim to spending time on building products that don’t bring value to stakeholders or customers.
DevOps teams usually gather feedback from stakeholders, end-users, and software-based monitoring technologies before, during, and after the release cycle. They collect feedback through various channels, such as social media and surveys, or by discussing with colleagues.
Teams need to have procedures that will help them sift through the feedback they’ve gathered to extract the most valuable information. Misleading or inaccurate feedback could prove to be detrimental to the entire development process.
8. Version Control
Version control, also known as source control, lies at the heart of every successful DevOps workflow. It helps DevOps teams stay organized, focused, and up to date with what members of the team are doing. Version control is also crucial for ensuring teams collaborate faster and easier to support frequent software releases.
In a nutshell, version control is a central code repository — a place where developers contribute their code and track changes during the development process. Most version control systems allow team members to create branches of the main project. Branches are copies of the project’s source code that individual developers can work on without modifying the original code.
Get started with Git, a popular version control tool, in no time by downloading our free Git Commands Cheat Sheet.
In a typical scenario, each developer works on a separate branch of the same project, submitting code updates and running automated tests. Before the newly written code gets merged with the master branch, automation will create a build of the application that will ensure the new code is compatible with the existing code.
If the build is successful, developers merge the new code with the master branch and deploy it to production or run other tests, depending on the workflow.
With a robust version control system in place, DevOps teams can be confident that only error-free code is moving down the pipeline and getting deployed to production.
9. Collaboration
The main idea behind DevOps is to establish trust among developers and operations. Dev and Ops teams need to communicate, share feedback, and collaborate throughout the entire development and deployment cycle.
In such a setting, both groups are responsible for ensuring the application delivers on its promises. That requires continuously optimizing and improving the performance, costs, and delivery of services while keeping users satisfied.
Creating this type of inclusive, collaborative environment also involves accepting a cultural shift within the company. To execute DevOps successfully, it’s crucial to have the stakeholders and DevOps teams be on the same page, working together to deliver software solutions that bring real value to the company and its customers. DevOps requires the entire company to behave like a startup, continuously adjusting to market changes, and investing time and resources in features that attract more customers.
Remember, a Devops Culture Change Requires a Unified Team
DevOps is just another buzzword without the proper implementation of certain principles that sit at the heart of DevOps.
DevOps revolves around specific technologies that help teams get the job done. However, DevOps is, first and foremost, a culture. Building a devops culture requires an organization to work as a unified team, from Development and Operations to stakeholders and management. That is what sets DevOps apart from other development models.
When transitioning to DevOps, remember that these principles are not set in stone. Organizations should implement DevOps methodologies based on their goals, workflows, resources, and the team’s skill set.

What is Hadoop? Hadoop Big Data Processing
The evolution of big data has produced new challenges that needed new solutions. As never before in history, servers need to process, sort and store vast amounts of data in real-time.
This challenge has led to the emergence of new platforms, such as Apache Hadoop, which can handle large datasets with ease.
In this article, you will learn what Hadoop is, what are its main components, and how Apache Hadoop helps in processing big data.
What is Hadoop?
The Apache Hadoop software library is an open-source framework that allows you to efficiently manage and process big data in a distributed computing environment.
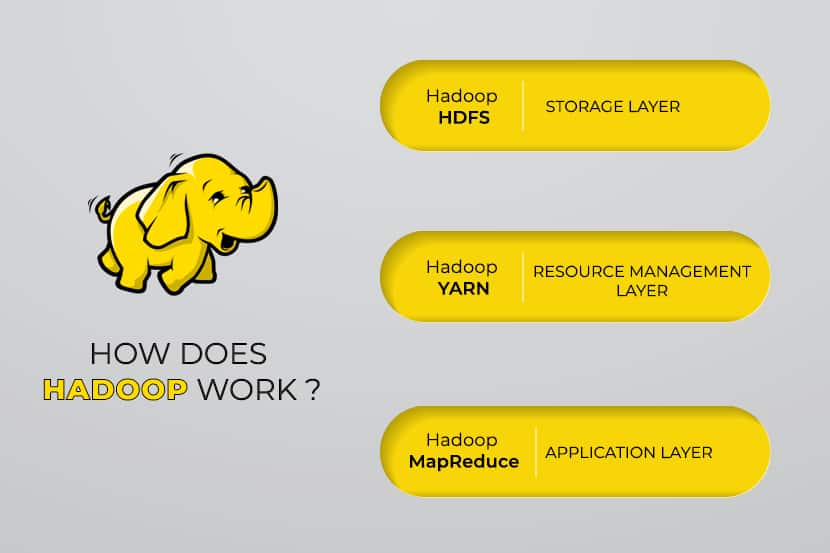
Apache Hadoop consists of four main modules:
Hadoop Distributed File System (HDFS)
Data resides in Hadoop’s Distributed File System, which is similar to that of a local file system on a typical computer. HDFS provides better data throughput when compared to traditional file systems.
Furthermore, HDFS provides excellent scalability. You can scale from a single machine to thousands with ease and on commodity hardware.
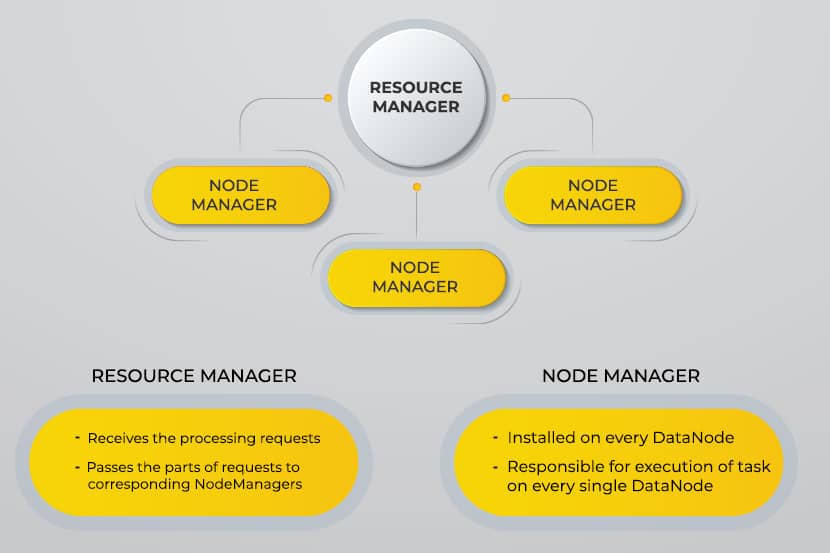
Yet Another Resource Negotiator (YARN)
YARN facilitates scheduled tasks, whole managing, and monitoring cluster nodes and other resources.
MapReduce
The Hadoop MapReduce module helps programs to perform parallel data computation. The Map task of MapReduce converts the input data into key-value pairs. Reduce tasks consume the input, aggregate it, and produce the result.
Hadoop Common
Hadoop Common uses standard Java libraries across every module.
To learn how Hadoop components interact with one another, read our article that explains Apache Hadoop Architecture.
Why Was Hadoop Developed?
The World Wide Web grew exponentially during the last decade, and it now consists of billions of pages. Searching for information online became difficult due to its significant quantity. This data became big data, and it consists of two main problems:
- Difficulty in storing all this data in an efficient and easy-to-retrieve manner
- Difficulty in processing the stored data
Developers worked on many open-source projects to return web search results faster and more efficiently by addressing the above problems. Their solution was to distribute data and calculations across a cluster of servers to achieve simultaneous processing.
Eventually, Hadoop came to be a solution to these problems and brought along many other benefits, including the reduction of server deployment cost.
How Does Hadoop Big Data Processing Work?
Using Hadoop, we utilize the storage and processing capacity of clusters and implement distributed processing for big data. Essentially, Hadoop provides a foundation on which you build other applications to process big data.
Applications that collect data in different formats store them in the Hadoop cluster via Hadoop’s API, which connects to the NameNode. The NameNode captures the structure of the file directory and the placement of “chunks” for each file created. Hadoop replicates these chunks across DataNodes for parallel processing.
MapReduce performs data querying. It maps out all DataNodes and reduces the tasks related to the data in HDFS. The name, “MapReduce” itself describes what it does. Map tasks run on every node for the supplied input files, while reducers run to link the data and organize the final output.
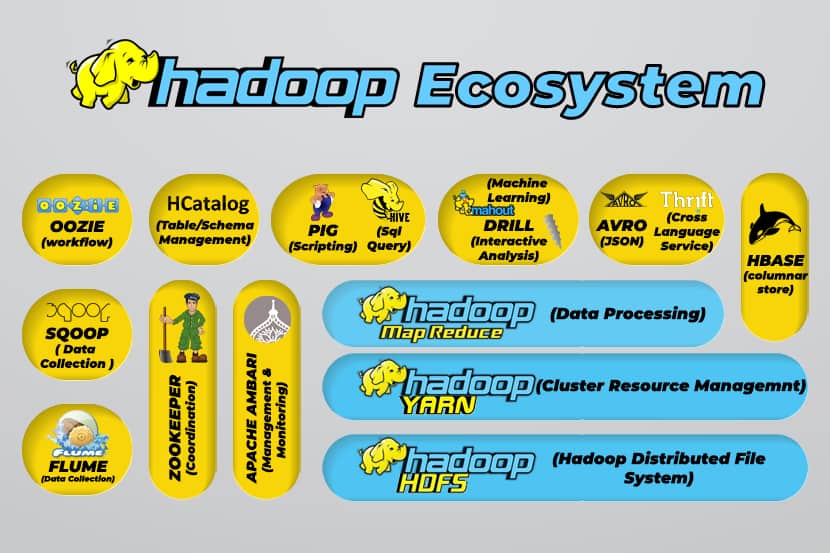
Hadoop Big Data Tools
Hadoop’s ecosystem supports a variety of open-source big data tools. These tools complement Hadoop’s core components and enhance its ability to process big data.
The most useful big data processing tools include:
- Apache Hive
Apache Hive is a data warehouse for processing large sets of data stored in Hadoop’s file system.
- Apache Zookeeper
Apache Zookeeper automates failovers and reduces the impact of a failed NameNode.
- Apache HBase
Apache HBase is an open-source non-relation database for Hadoop.
- Apache Flume
Apache Flume is a distributed service for data streaming large amounts of log data.
- Apache Sqoop
Apache Sqoop is a command-line tool for migrating data between Hadoop and relational databases.
- Apache Pig
Apache Pig is Apache’s development platform for developing jobs that run on Hadoop. The software language in use is Pig Latin.
- Apache Oozie
Apache Oozie is a scheduling system that facilitates the management of Hadoop jobs.
- Apache HCatalog
Apache HCatalog is a storage and table management tool for sorting data from different data processing tools.
If you are interested in Hadoop, you may also be interested in Apache Spark. Learn the differences between Hadoop and Spark and their individual use cases.
Advantages of Hadoop
Hadoop is a robust solution for big data processing and is an essential tool for businesses that deal with big data.
The major features and advantages of Hadoop are detailed below:
- Faster storage and processing of vast amounts of data
The amount of data to be stored increased dramatically with the arrival of social media and the Internet of Things (IoT). Storage and processing of these datasets are critical to the businesses that own them.
- Flexibility
Hadoop’s flexibility allows you to save unstructured data types such as text, symbols, images, and videos. In traditional relational databases like RDBMS, you will need to process the data before storing it. However, with Hadoop, preprocessing data is not necessary as you can store data as it is and decide how to process it later. In other words, it behaves as a NoSQL database.
- Processing power
Hadoop processes big data through a distributed computing model. Its efficient use of processing power makes it both fast and efficient.
- Reduced cost
Many teams abandoned their projects before the arrival of frameworks like Hadoop, due to the high costs they incurred. Hadoop is an open-source framework, it is free to use, and it uses cheap commodity hardware to store data.
- Scalability
Hadoop allows you to quickly scale your system without much administration, just by merely changing the number of nodes in a cluster.
- Fault tolerance
One of the many advantages of using a distributed data model is its ability to tolerate failures. Hadoop does not depend on hardware to maintain availability. If a device fails, the system automatically redirects the task to another device. Fault tolerance is possible because redundant data is maintained by saving multiple copies of data across the cluster. In other words, high availability is maintained at the software layer.
The Three Main Use Cases
Processing big data
We recommend Hadoop for vast amounts of data, usually in the range of petabytes or more. It is better suited for massive amounts of data that require enormous processing power. Hadoop may not be the best option for an organization that processes smaller amounts of data in the range of several hundred gigabytes.
Storing a diverse set of data
One of the many advantages of using Hadoop is that it is flexible and supports various data types. Irrespective of whether data consists of text, images, or video data, Hadoop can store it efficiently. Organizations can choose how they process data depending on their requirement. Hadoop has the characteristics of a data lake as it provides flexibility over the stored data.
Parallel data processing
The MapReduce algorithm used in Hadoop orchestrates parallel processing of stored data, meaning that you can execute several tasks simultaneously. However, joint operations are not allowed as it confuses the standard methodology in Hadoop. It incorporates parallelism as long as the data is independent of each other.
What is Hadoop Used for in the Real World
Companies from around the world use Hadoop big data processing systems. A few of the many practical uses of Hadoop are listed below:
- Understanding customer requirements
In the present day, Hadoop has proven to be very useful in understanding customer requirements. Major companies in the financial industry and social media use this technology to understand customer requirements by analyzing big data regarding their activity.
Companies use that data to provide personalized offers to customers. You may have experienced this through advertisements shown on social media and eCommerce sites based on our interests and internet activity.
- Optimizing business processes
Hadoop helps to optimize the performance of businesses by better analyzing their transaction and customer data. Trend analysis and predictive analysis can help companies to customize their products and stocks to increase sales. Such analysis will facilitate better decision making and lead to higher profits.
Moreover, companies use Hadoop to improve their work environment by monitoring employee behavior by collecting data regarding their interactions with each other.
- Improving health-care services
Institutions in the medical industry can use Hadoop to monitor the vast amount of data regarding health issues and medical treatment results. Researchers can analyze this data to identify health issues, predict medication, and decide on treatment plans. Such improvements will allow countries to improve their health services rapidly.
- Financial trading
Hadoop possesses a sophisticated algorithm to scan market data with predefined settings to identify trading opportunities and seasonal trends. Finance companies can automate most of these operations through the robust capabilities of Hadoop.
- Using Hadoop for IoT
IoT devices depend on the availability of data to function efficiently. Manufacturers and inventors use Hadoop as the data warehouse for billions of transactions. As IoT is a data streaming concept, Hadoop is a suitable and practical solution to managing the vast amounts of data it encompasses.
Hadoop is updated continuously, enabling us to improve the instructions used with IoT platforms.
Other practical uses of Hadoop include improving device performance, improving personal quantification and performance optimization, improving sports and scientific research.
What are the Challenges of Using Hadoop?
Every application comes with both advantages and challenges. Hadoop also introduces several challenges:
- The MapReduce algorithm isn’t always the solution
The MapReduce algorithm does not support all scenarios. It is suitable for simple information requests and issues that be chunked up into independent units, but not for iterative tasks.
MapReduce is inefficient for advanced analytic computing as iterative algorithms require intensive intercommunication, and it creates multiple files in the MapReduce phase.
- Completely developed data management
Hadoop does not provide comprehensive tools for data management, metadata, and data governance. Furthermore, it lacks the tools required for data standardization and determining quality.
- Talent gap
Due to Hadoop’s steep learning curve, it can be difficult to find entry-level programmers with Java skills that are sufficient to be productive with MapReduce. This intensiveness is the main reason that the providers are interested in putting relational (SQL) database technology on top of Hadoop because it is much easier to find programmers with sound knowledge in SQL rather than MapReduce skills.
Hadoop administration is both an art and a science, requiring low-level knowledge of operating systems, hardware, and Hadoop kernel settings.
- Data security
The Kerberos authentication protocol is a significant step towards making Hadoop environments secure. Data security is critical to safeguard big data systems from fragmented data security issues.
Apache Hadoop is open-source. Try it out yourself and install Hadoop on Ubuntu.
Conclusion
Hadoop is highly effective at addressing big data processing when implemented effectively with the steps required to overcome its challenges. It is a versatile tool for companies that deal with extensive amounts of data.
One of its main advantages is that it can run on any hardware and a Hadoop cluster can be distributed among thousands of servers. Such flexibility is particularly significant in infrastructure-as-code environments.

What is Pulumi? Introduction to Infrastructure as Code
The concept of managing infrastructure as code is essential in DevOps environments. Furthermore, it would be impossible to maintain an efficient DevOps pipeline without it. Infrastructure-as-code tools such as Pulumi help DevOps teams automate their resource provisioning schemes at scale.
This article will introduce you to the concept of infrastructure-as-code. You will also learn why Pulumi, a modern infrastructure as code tool, is a popular tool in the DevOps community.
Infrastructure as Code Explained
Infrastructure-as-Code (IaC) is the process of automating resource provisioning and management schemes using descriptive coding languages.
Before infrastructure as code (IaC), system administrators had to manually configure, deploy, and manage server resources. They would have to configure bare metal machines before they could deploy apps. Manually managing infrastructure caused many problems. It was expensive, slow, hard to scale, and prone to human error.
With the introduction of cloud computing, deploying virtualized environments was simplified, but administrators still had to deploy the environment manually.. They had to log into the cloud provider’s web-based dashboard and click buttons to deploy desired server configurations.
However, when you need to deploy hundreds of servers across multiple cloud providers and locations as fast as possible, doing everything by hand is impractical.
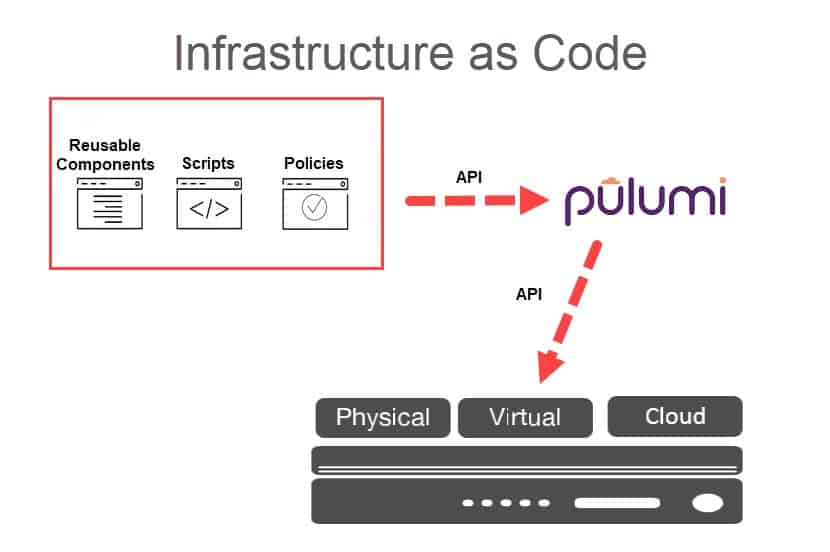
IaC enables DevOps teams to deploy and manage infrastructure at scale and across multiple providers with simple instructions. All it takes is writing a configuration file and executing it to deploy the desired environments automatically. Code algorithms define the type of environment required, and automation deploys it.
What is Pulumi?
Pulumi is an open-source infrastructure as code tool that utilizes the most popular programming languages to simplify provisioning and managing cloud resources.
Founded in 2017, Pulumi has fundamentally changed the way DevOps teams approach the concept of infrastructure-as-code. Instead of relying on domain-specific languages, Pulumi enables organizations to use real programming languages to provision and decommission cloud-native infrastructure.
Unlike Terraform, which has its proprietary language and syntax for defining infrastructure as code, Pulumi uses real languages. You can write configuration files in Python, JavaScript, or TypeScript. In other words, you are not forced to learn a new programming language only to manage infrastructure.
To see how Pulumi stacks up against other similar solutions, read our article Pulumi vs Terraform
As a cloud-native platform, Pulumi allows you to deploy any type of cloud infrastructure — virtual servers, containers, applications, or serverless functions. You can also deploy and manage resources across multiple cloud providers such as AWS, Microsoft Azure, or PNAP Bare Metal Cloud.
phoenixNAP’s Bare Metal Cloud (BMC) platform is fully integrated with Pulumi. This integration enables DevOps teams to deploy, scale, and decommission cloud-native bare metal server instances automatically. As a non-virtualized physical server infrastructure, BMC delivers unmatched performance needed for running processor-intensive workloads.
Pulumi’s unique approach to IaC enables DevOps teams to manage their infrastructure as an application written in their chosen language. Using Pulumi, you can take advantage of functions, loops, and conditionals to create dynamic cloud environments. Pulumi helps developers create reusable components, eliminating the hassle of copying and pasting thousands of code lines.
Pulumi supports the following programming languages:
● Python
● JavaScript
● Go
● TypeScript
● .NET languages (C#, F#, and VB)
How Pulumi Works?
Pulumi has become the favorite infrastructure-as-code tool in DevOps environments because of its multi-language and multi-cloud nature. It provides DevOps engineers with a familiar method of managing resources.
Pulumi does this through its cloud object model and evaluation runtime. It takes your program written in any language, figures out what cloud resources you want to manage, and executes your program. All this is possible because it is inherently language-neutral and cloud-neutral.
Three components make up the core Pulumi system:
• Language host. The language host runs your Pulumi program to create an environment and register resources with the deployment engine.
• Deployment engine. It runs numerous checks and computations to determine if it should create, update, delete, or replicate resources.
• Resource providers. Pulumi automatically downloads packages and plugins in the background according to your language and cloud provider specifications.
Pulumi lets you manage your infrastructure through a web app or command-line interface (CLI).
To start using Pulumi, you first have to register and create an account. Once registered, you have to specify the programming language and the cloud service, provider.
If you prefer to use the CLI, you will need to install it on your local machine and authenticate it with your account and provide secret credentials that you get from your cloud provider.
For a detailed explanation of how Pulumi works, take a look at this quick tutorial.
8 Features and Advantages of Pulumi
1. Open-source: Pulumi is free for unlimited individual use. However, if you want to use it within a team, you will have to pay a small yearly fee.
2. Multi-language: Use your favorite programming language to write infrastructure configuration files. As a language-neutral IaC platform, Pulumi doesn’t force you to learn a new programming language, nor does it use domain-specific languages. You don’t have to write a single line of YAML code with Pulumi.
3. Multi-cloud: Provision, scale, and decommission infrastructure and resources across numerous cloud service providers. Among them, phoenixNAP’s Bare Metal Cloud platform, Google Cloud, AWS, Microsoft Azure.
4. Feature-rich CLI: The driving force that makes Pulumi so versatile is its simple yet powerful command-line interface (CLI). Through the CLI, deploying and decommissioning cloud infrastructure and servers is conducted with a set of commands issued in the terminal. You can use Pulumi on Linux, Windows, and OS X.
5. Cloud object model: The underlying cloud object model offers a detailed overview of how your programs are constructed. It delivers a unified programming model that lets you manage cloud software anywhere and across any cloud provider.
6. Stacks: Stacks are isolated instances of your cloud program that differ from your other programs. With Pulumi, you can deploy numerous stacks for various purposes. For example, you can deploy and decommission staging stacks, testing stacks, or a production stack.
7. Reusable components: There is no need to copy and paste thousands of lines of code. Pulumi helps you follow best coding practices by allowing you to reuse existing code across different projects. The code does not define just a single instance; it defines the entire architecture.
8. Unified architecture: DevOps organizations can use and reuse components to manage infrastructure and build a unique architecture and testing policy. Such freedom enables teams to build an internal platform.
Conclusion
Pulumi’s support for the most popular programming languages helps DevOps stay productive without wasting time managing infrastructure. While Pulumi might not be the only infrastructure-as-code tool that doesn’t enforce a proprietary language, it is undoubtedly the most flexible because it’s cloud-agnostic.
You can leverage the power of Pulumi across multiple cloud providers by writing configuration files in languages that you are already using to run your apps.

What is AIOps? Definitive Guide to Artificial Intelligence for IT Operations
From Business Analysis to DevOps and Data Analysis, Artificial Intelligence (AI) has been branching out to all IT segments. The latest application of AI, AIOps, helps IT teams automate tedious tasks and minimizes the chances for human error.
Learn what AIOps is, how organizations use it to enhance their IT workflows, and how to start using AIOps to improve your IT environment’s efficiency.
What is AIOps?
AIOps stands for Artificial Intelligence for IT Operations. AIOps is using AI and machine learning to monitor and analyze data from every corner of an IT environment. It uses algorithmic analysis of data to provide DevOps and ITOps teams with the means to make informed decisions and automate tasks. It’s vital to note that AIOps does not take people out of the equation. The use of AI fills in the operational gaps that commonly cause difficulties for humans.
Here’s a quick summary of what AIOps can do for an organization:
- Filter low-priority alerts from attention-worthy problems
- Help identify and quickly resolve system issues
- Automate repetitive tasks
- Detect system anomalies and deviations
- Put a stop to traditional team silos
It is challenging to assess how AIOps fits into the current IT landscape. It does not replace any existing monitoring, log management, or orchestration tools. AIOps exists at the junction of all the tools and domains, processing and integrating information across the entire IT infrastructure. By doing so, AIOps turns partial views into a synchronized, 360-degree picture of operations that is easy to keep track of.
AIOps environments are made out of sets of specialized algorithms narrowly focused on specific tasks.
These algorithms can pick out alerts from noisy event streams, identify correlations between issues, use historical data to auto-resolve reoccurring problems, etc. The cumulative effect of all these processes can do wonders for a business. It boosts system’s stability and performance while preventing issues from impairing critical operations.
 AIOps Architecture
 AIOps Architecture
AIOps has two central components: Big Data and Machine Learning.
It aggregates observational data from monitoring systems and engagement data from tickets, incidents, and event recordings. AIOps then performs comprehensive analytics of the gathered data and uses machine learning to figure out improvements and fixes. Think of it as an automation-driven continuous integration and deployment (CI/CD) for IT functions.
The entire process starts with monitoring. An essential aspect of an AIOps architecture, these tools can work with multiple sources and handle the immense volume and wide disparity of data in modern IT environments. Once it has access to all the info, an AIOps platform typically uses a data lake or a similar repository to collect and disperse the data.
After processing data, AIOps systems derive insights through various AI-fueled activities, such as analytics, pattern matching, natural language processing, correlation, and anomaly detection. Finally, AIOps makes extensive use of automation to act upon its findings.
 AIOps Enhances DevOps
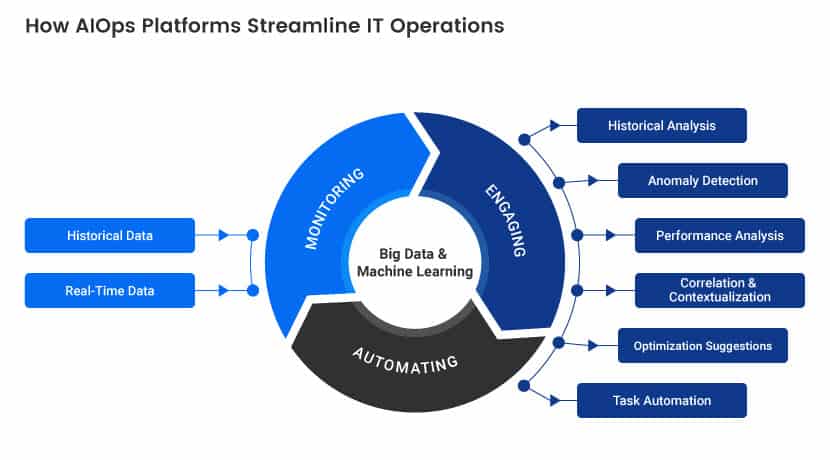 AIOps Enhances DevOps
AIOps is not a separate entity from DevOps, but instead a set of technologies that complement the goals of DevOps engineers and help them embrace the scale and speed needed for modern development.
The world of DevOps revolves around agility and flexibility. AIOps platforms can help automate steps from development to production, projecting the effects of deployment and auto-responding to alterations in a dynamic IT environment.
AIOps can also help handle the velocity, volume, and variety of data generated by DevOps pipelines, sorting and making sense of them in real-time to keep app delivery stable and fast.
Here are the benefits AIOps can offer to DevOps engineers:
- Help understand the ins and outs of DEV, QA, and production environments.
- Identify optimal fixes
- Test ideas in a quick and safe fashion
- Automate repetitive tasks
- Minimize human error
- Determine improvements and optimizations
AIOps ensures the use of DevOps engineers goes towards complex tasks that cannot be automated. It allows humans to focus on areas of development that drive maximum profitability for a business.
 Benefits of AIOps
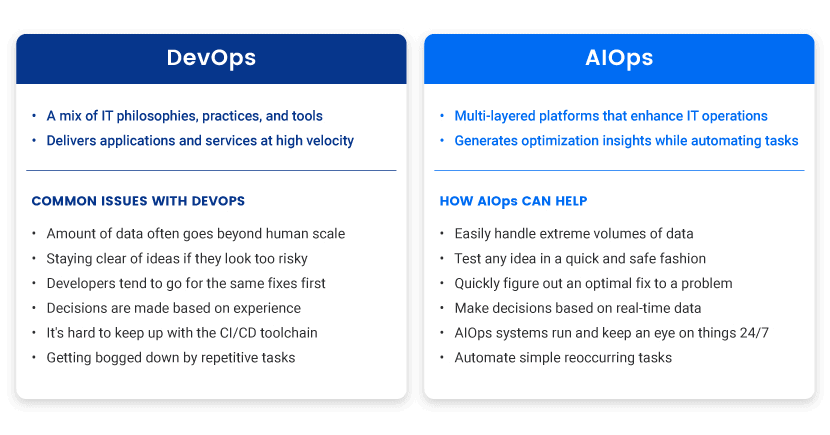 Benefits of AIOps
Depending on individual operations and workflows, certain benefits of AIOps can be more impactful than others. Nevertheless, here’s a breakdown of key advantages that come with deploying AIOps:
Noise reduction
By identifying low-priority alerts through machine learning and pattern recognition, AIOps helps IT specialists comb through high volumes of event alarms without getting caught up in irrelevant or false alerts.
Noise reduction saves a lot of time, but it also allows business-affecting incidents to be spotted and resolved before they cause damage.
Unified view of the IT environment
AIOps correlates data across various data sources and analyzes them as one. AIOps eliminates information silos and gives a contextualized vision across the entire IT estate. That allows all teams to be on the same holistic page, turning the entire system into a well-oiled machine.
Meaningful data analysis
AIOps brings all the data across the system into one place, enabling more meaningful analysis that is quick due to AI and thorough as it leaves no digital stone unturned.
By bringing all the data together and accurately analyzing it, AIOps makes a substantial impact on the decision-making front.
Time-saving process automation
Thanks to knowledge recycling and root cause analysis, AIOps automates simple recurring operations.
Upon discovering an issue, AIOps react to it in real-time. Depending on the nature of the problem, it initiates an action or moves to the next step without the need for human intervention.
A proactive approach to problem management
AIOps analyze historical data in search of patterns in system behavior. AiOps is a great way to stay ahead of future incidents, enabling teams to fix root causes and run a more seamless system.
Between automation, problem-solving, and in-depth analytics, AIOps tools make workflows quicker and more consistent. Consequently, it reduces the chance for human errors to occur. Meanwhile, IT teams get to focus on their areas of expertise instead of having to deal with low-value tasks that distract and slow them down.
AIOps Use Cases
AIOps continually evolves and offers new functionalities, and currently, it is used in the following use cases:
Intelligent alert monitoring and escalation
By ingesting data from all sections of an IT environment, AIOps tools stop alert storms from causing domino effects through connected systems. It reduces alert fatigue and helps accurately prioritize issues.
Cross-domain situational understanding
AIOps create causality/relationships while aggregating data, granting a continuous clear line of sight across the entire IT estate.
Automatic root cause analysis
Once an alert happens, an AIOps platform presents top suspected causes, as well as the evidence that led it to such a conclusion.
Automatic remediation of IT environment issues
AIOps automate remediation for problems that already transpired on several occasions. They use historical data from past issues to identify them and either offer the best solution or remedy the issues outright.
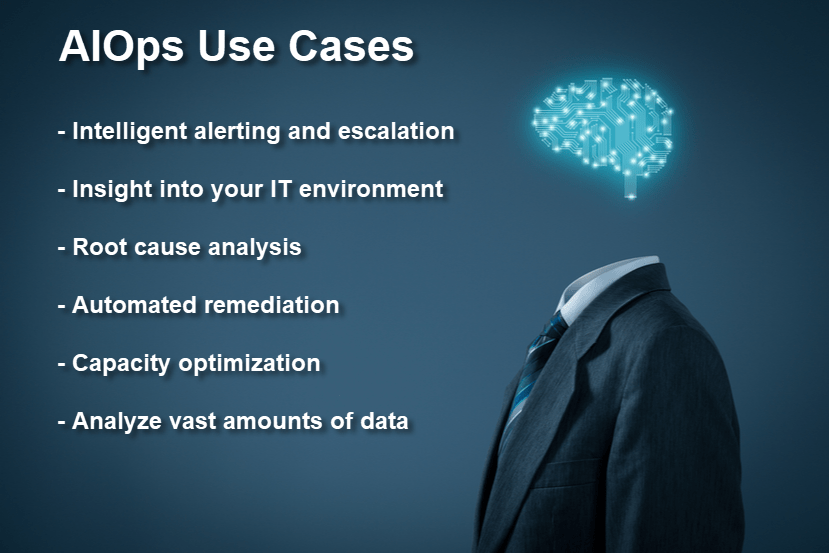
Monitor application uptime
By proactively monitoring raw utilization, bandwidth, CPU, memory, and more, AI-based analytics can be used to increase overall application uptime.
Cohort analysis
While humans struggle with it, analyzing vast amounts of data is a forte of AIOps that can handle large systems with ease.
Organizations Adopting AIOps
Different reasons push organizations towards AIOps. Organizations at the forefront of adopting artificial intelligence in IT operations are enterprises with large environments, cloud-native SMEs, organizations with overburdened DevOps teams, and companies with hybrid cloud and on-prem environments.
Most organizations hail the same positive effects following deployment, as evidenced by a survey performed by OpsRamp:
- Around 87% of organizations said that the AIOps-powered solution delivered good results
- The most common use case was Intelligent alerting, mentioned by 67% of organizations, followed by root cause analysis which was highlighted by 61% of the respondents
- Over 50% of organizations mentioned anomaly/threat detection, capacity optimization, and incident auto-remediation as crucial upgrades to their system(s)
- Over 85% of polled organizations said they were able to automate tedious tasks thanks to AIOps
- 77% of organizations claim the number of open incident tickets went down upon implementing AIOps

It is unsurprising that there’s been an 83% increase in the number of organizations currently deploying or thinking about deploying AIOps since 2018. Forward-thinking companies see AIOps as an opportunity to move past brittle rules-based processes, information silos, and the excess of repetitive manual activities.
While evaluating the benefits of AIOps, it’s essential to look beyond its ability to reduce costs directly. By preventing disruptions of critical digital services, as well as accelerating detection and resolution, AIOps paves the way towards better user experience and bumps up customer retention. It also leaves ample room for an IT team to innovate and focus on value-packed activities, which keeps top talent happy and away from competitors.
Implement & Get Started With Artificial Intelligence for IT Operations
The shift towards AIOps starts at the drawing board. Here are pointers in case you’re weighing whether AIOps is the right choice for your team:
Learn about AI
You should know as much about AI-powered operations as humanly possible. This article is a great start, but you should consider hiring an IT consultant to better gauge your system’s fit with AIOps. You also want to familiarize yourself with the capabilities of AI and ML to get a better sense of what these technologies can offer.
Identify Time-Consuming IT Tasks
Identify where the bulk of the team’s time and effort is being poured. If you conclude that most of the energy is going towards solving mundane and repetitive tasks, you’re likely a prime candidate for implementing AIOps.
Consider other applications
Data management is a massive component of AIOps that’s not reserved exclusively for your IT department. Business analytics and statistical analysis are key for any modern organization, so check if you have needs for AIOps on those fronts as well.
Automate one process at a time
There’s no need to go all-in on AIOps immediately. Identify your highest-priority problem and assess how this technology could solve it. Deploy the use of AI there first and later consider expanding it across other systems if it yields results.
Measure speed and efficiency
To know whether hefty investments in AIOps are paying off, you need to know which metrics you’ll keep an eye on. Ways of measuring ROI and success vary on a business-to-business basis, but most metrics involve measuring improvements in the speed and efficiency of processes.
Takeaway
The global AIOps market is projected to grow to $11.02 billion by 2023, enjoying a 34% combined annual growth rate (CAGR) in the meantime.
Interest in benefits of AIOps picked up as organizations began to seek ways to manage the velocity, volume, and variety of digital data that goes beyond human scale. The field demonstrates a clear ability to improve customer and talent retention rates. It is expected that the number of companies looking to implement artificial intelligence in IT operations will skyrocket.
AIOps is here to stay. Its ability to allow ITOps to focus on solving critical and high-value issues instead of “keeping the lights on” is game-changing. It’s only a matter of time before AIOps becomes the industry norm.

What is DevOps Pipeline & How to Build One
Today, people expect to see their favorite apps with the latest bells and whistles faster than ever. Long gone are the days when developers had years to develop and release new software products.
Hence, every software-development company needs an effective DevOps pipeline to keep up with customers’ demands and requirements.
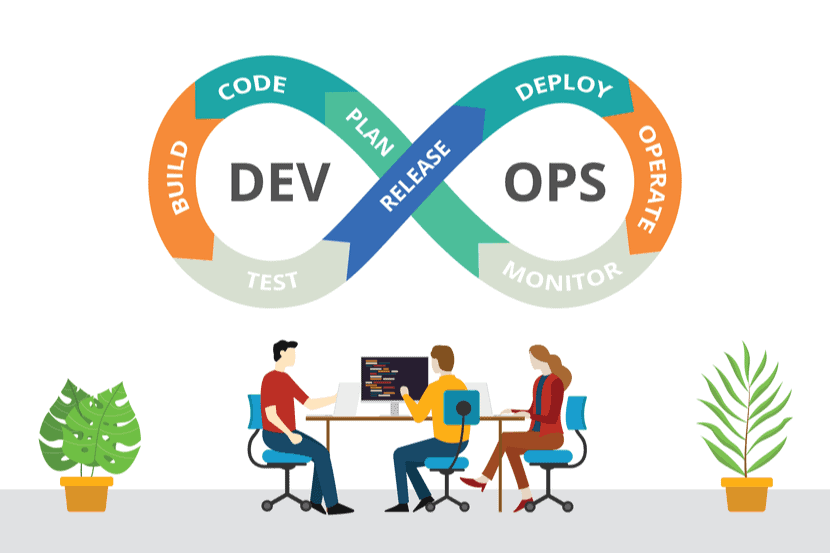
This article covers the basic concepts of a DevOps pipeline, how pipelines work in DevOps environments, and explains the stages code has to pass through before being deployed to production.
What is a DevOps Pipeline?
A DevOps pipeline is a set of practices that the development (Dev) and operations (Ops) teams implement to build, test, and deploy software faster and easier. One of the primary purposes of a pipeline is to keep the software development process organized and focused.
The term “pipeline” might be a bit misleading, though. An assembly line in a car factory might be a more appropriate analogy since software development is a continuous cycle.
Before the manufacturer releases the car to the public, it must pass through numerous assembly stages, tests, and quality checks. Workers have to build the chassis, add the motor, wheels, doors, electronics, and a finishing paint job to make it appealing to customers.
DevOps pipelines work similarly.
Before releasing an app or a new feature to users, you first have to write the code. Then, make sure that it does not lead to any fatal errors that might cause the app to crash. Avoiding such a scenario involves running various tests to fish out any bugs, typos, or mistakes. Finally, once everything is working as intended, you can release the code to users.
From this simplified explanation, you can conclude that a DevOps pipeline consists of the build, test, and deploy stages.
Components of a DevOps Pipeline
To ensure the code moves from one stage to the next seamlessly requires implementing several DevOps strategies and practices. The most important among them are continuous integration and continuous delivery (CI/CD).
Continuous Integration
Continuous integration (CI) is a method of integrating small chunks of code from multiple developers into a shared code repository as often as possible. With a CI strategy, you can automatically test the code for errors without having to wait on other team members to contribute their code.
One of the key benefits of CI is that it helps large teams prevent what is known as integration hell.
In the early days of software development, developers had to wait for a long time to submit their code. That delay significantly increased the risk of code-integration conflicts and the deployment of bad code. As opposed to the old way of doing things, CI encourages developers to submit their code daily. As a result, they can catch errors faster and, ultimately, spend less time fixing them.
At the heart of CI is a central source control system. Its primary purpose is to help teams organize their code, track changes, and enable automated testing.
In a typical CI set-up, whenever a developer pushes new code to the shared code repository, automation kicks in to compile the new and existing code into a build. If the build process fails, developers get an alert which informs them which lines of code need to be reworked.
Making sure only quality code passes through the pipeline is of paramount importance. Therefore, the entire process is repeated every time someone submits new code to the shared repository.
Continuous Delivery
Continuous delivery (CD) is an extension of CI. It involves speeding up the release process by encouraging developers to release code to production in incremental chunks.
Having passed the CI stage, the code build moves to a holding area. At this point in the pipeline, it’s up to you to decide whether to push the build to production or hold it for further evaluation.
In a typical DevOps scenario, developers first push their code into a production-like environment to assess how it behaves. However, the new build can also go live right away, and developers can deploy it at any time with a push of a button.
To take full advantage of continuous delivery, deploy code updates as often as possible. The release frequency depends on the workflow, but it’s usually daily, weekly, or monthly. Releasing code in smaller chunks is much easier to troubleshoot compared to releasing all changes at once. As a result, you avoid bottlenecks and merge conflicts, thus maintaining a steady, continuous integration pipeline flow.
Continuous Deployment
Continuous delivery and continuous deployment are similar in many ways, but there are critical differences between the two.
While continuous delivery enables development teams to deploy software, features, and code updates manually, continuous deployment is all about automating the entire release cycle.
At the continuous deployment stage, code updates are released automatically to the end-user without any manual interventions. However, implementing an automated release strategy can be dangerous. If it fails to mitigate all errors detected along the way, bad code will get deployed to production. In the worst-case scenario, this may cause the application to break or users to experience downtime.
Automated deployments should only be used when releasing minor code updates. In case something goes wrong, you can roll back the changes without causing the app to malfunction.
To leverage the full potential of continuous deployment involves having robust testing frameworks that ensure the new code is truly error-free and ready to be immediately deployed to production.
Continuous Testing
Continuous testing is a practice of running tests as often as possible at every stage of the development process to detect issues before reaching the production environment. Implementing a continuous testing strategy allows quick evaluation of the business risks of specific release candidates in the delivery pipeline.
The scope of testing should cover both functional and non-functional tests. This includes running unit, system, integration, and tests that deal with security and performance aspects of an app and server infrastructure.
Have you heard about DevSecOps? To learn how security and DevOps principles work together refer to- What is DevSecOps?
Continuous testing encompasses a broader sense of quality control that includes risk assessment and compliance with internal policies.
Continuous Operations
Having a comprehensive continuous operations strategy helps maintain maximum availability of apps and environments. The goal is for users to be unaware that of constantly releasing code updates, bug fixes, and patches. A continuous operations strategy can help prevent downtime and availability issues during code release.
To reap the benefits of continuous operations, you need to have a robust automation and orchestration architecture that can handle continuous performance monitoring of servers, databases, containers, networks, services, and applications.
Phases of DevOps Pipeline
There are no fixed rules as to how you should structure the pipeline. DevOps teams add and remove certain stages depending on their specific workflows. Still, four core stages make up almost every pipeline: develop, build, test, and deploy.
That set-up can be extended by adding two more stages — plan and monitor — since they are also quite common in professional DevOps environments.
Plan
The planning stage involves planning out the entire workflow before developers start coding. In this stage, product managers and project managers play an essential role. It’s their job to create a development roadmap that will guide the whole team along the process.
After gathering feedback and relevant information from users and stakeholders, the work is broken down into a list of tasks. By segmenting the project into smaller, manageable chunks, teams can deliver results faster, resolve issues on the spot, and adapt to sudden changes easier.
In a DevOps environment, teams work in sprints — a shorter period of time (usually two weeks long) during which individual team members work on their assigned tasks.
Develop
In the Develop stage, developers start coding. Depending on the programming language, developers install on their local machines appropriate IDEs, code editors, and other technologies for achieving maximum productivity.
In most cases, developers have to follow certain coding styles and standards to ensure a uniform coding pattern. This makes it easier for any team member to read and understand the code.
When developers are ready to submit their code, they make a pull request to the shared source code repository. Team members can then manually review the newly submitted code and merge it with the master branch by approving the initial pull request.
Build
The build phase of a DevOps pipeline is crucial because it allows developers to detect errors in the code before they make their way down the pipeline and cause a major disaster.
After the newly written code has been merged with the shared repository, developers run a series of automated tests. In a typical scenario, the pull request initiates an automated process that compiles the code into a build — a deployable package or an executable.
Keep in mind that some programming languages don’t need to be compiled. For example, applications written in Java and C need to be compiled to run, while those written in PHP and Python do not.
If there is a problem with the code, the build fails, and the developer is notified of the issues. If that happens, the initial pull request also fails.
Developers repeat this process every time they submit to the shared repository to ensure only error-free code continues down the pipeline.
Test
If the build is successful, it moves to the testing phase. There, developers run manual and automated tests to validate the integrity of the code further.
In most cases, a User Acceptance Test is performed. People interact with the app as the end-user to determine if the code requires additional changes before sending it to production. At this stage, it’s also common to perform security, performance, and load testing.
Deploy
When the build reaches the Deploy stage, the software is ready to be pushed to production. An automated deployment method is used if the code only needs minor changes. However, if the application has gone through a major overhaul, the build is first deployed to a production-like environment to monitor how the newly added code will behave.
Implementing a blue-green deployment strategy is also common when releasing significant updates.
A blue-green deployment means having two identical production environments where one environment hosts the current application while the other hosts the updated version. To release the changes to the end-user, developers can simply forward all requests to the appropriate servers. If there are problems, developers can simply revert to the previous production environment without causing service disruptions.
Monitor
At this final stage in the DevOps pipeline, operations teams are hard at work continuously monitoring the infrastructure, systems, and applications to make sure everything is running smoothly. They collect valuable data from logs, analytics, and monitoring systems as well as feedback from users to uncover any performance issues.
Feedback gathered at the Monitor stage is used to improve the overall efficiency of the DevOps pipeline. It’s good practice to tweak the pipeline after each release cycle to eliminate potential bottlenecks or other issues that might hinder productivity.
How to Create a DevOps Pipeline
Now that you have a better understanding of what a DevOps pipeline is and how it works let’s explore the steps required when creating a CI/CD pipeline.
Set Up a Source Control Environment
Before you and the team start building and deploying code, decide where to store the source code. GitHub is by far the most popular code-hosting website. GitLab and BitBucket are powerful alternatives.
To start using GitHub, open a free account, and create a shared repository. To push code to GitHub, first install Git on the local machine. Once you finish writing the code, push it to the shared source code repository. If multiple developers are working on the same project, other team members usually manually review the new code before merging it with the master branch.
If you are new to Git, check out our Git Commands List article with a free downloadable Cheat Sheet.
Set Up a Build Server
Once the code is on GitHub, the next step is to test it. Running tests against the code helps prevent errors, bugs, or typos from being deployed to users.
Numerous tests can determine if the code is production-ready. Deciding which analyses to run depends on the scope of the project and the programming languages used to run the app.
Two of the most popular solutions for creating builds are Jenkins and Travis-CI. Jenkins is completely free and open-source, while Travis-CI is a hosted solution that is also free but only for open-source projects.
To start running tests, install Jenkins on a server and connect it to the GitHub repository. You can then configure Jenkins to run every time changes are made to the code in the shared repository. It compiles the code and creates a build. During the build process, Jenkins automatically alerts if it encounters any issues.
Run Automated Tests
There are numerous tests, but the most common are unit tests, integration tests, and functional tests.
Depending on the development environment, it’s best to arrange automated tests to run one after the other. Usually, you want to run the shortest tests at the beginning of the testing process.
For example, you would run unit tests before functional tests since they usually take more time to complete. If the build passes the testing phase with flying colors, you can deploy the code to production or a production-like environment for further evaluation.
Deploy to Production
Before deploying the code to production, first set up the server infrastructure. For instance, for deploying a web app, you need to install a web server like Apache. Assuming the app will be running in the cloud, you’ll most likely deploy it to a virtual machine.
For apps that require the full processing potential of the physical hardware, you can deploy to dedicated servers or bare metal cloud servers.
There are two ways to deploy an app — manually or automatically. At first, it is best to deploy code manually to get a feel for the deployment process. Later, automation can speed up the process, but only if you are confident, there are barriers that will stop bad code from ending up in production.
Releasing code to production is a straightforward process. The easiest way to deploy is by configuring the build server to execute a script that automatically releases the code to production.
In Closing
Now you understand what a devops pipeline is and how it can help speed up your software development life cycle.
However, this is just the tip of the iceberg.
The DevOps pipeline is a broad subject, and every organization will have its way of integrating one into their workflows. The ultimate goal is to create a repeatable system that takes advantage of automation and enables continuous improvements to help deliver high-quality products faster and easier.
Transition to DevOps in 6 Simple Steps
A year ago, the executives at phoenixNAP decided to embark on a new project – to create a flagship product that would be part of the solutions portfolio. The executives challenged the way products are developed and wanted to explore new ways of launching products swiftly.
Following internal discussions, the decision was to try out a new method of developing products. The decision was to go with a DevOps team.
In this article, Peter Borg, SCRUM Master at phoenixNAP, explains the necessary steps and challenges to be overcome to transition to a DevOps culture.
Steps to Transition to DevOps
Historically the company has faced some issues with a traditional Agile setup, which has led to delays in delivering projects. If a SCRUM team is operating at full speed to achieve a goal, but the infrastructure is not ready, delivery is delayed. Department segregation might create a situation where a supporting team might not have the resources to support a SCRUM team. One department alone does not deliver software products, and that is what we wanted to change by transitioning to DevOps.
1. Create Self-Sufficient Teams
To kick start the new DevOps culture change, we formed a new team whose job descriptions were unique to the company. We moved away from full stack developers to DevOps software engineers, and from SysAdmins to Site Reliability Engineers (SREs).
By doing so, we were able to formulate a self-sufficient team, and its goal was to deliver the project at hand. Hiring the right people was vital, in addition to having expertise in specific aspects of the new technology stack where they can deliver the product without relying on people outside the team.
SREs were tasked to code the infrastructure, Software Engineers to develop the applications, QA Engineers to set up the automation testing frameworks, and Software and System Architects to design the solution.
Even though people were earmarked for specific tasks based on their area of knowledge, we promoted the cross-pollination of knowledge. SREs contributed to the software code, software engineers pitched into our Infrastructure-as-Code (IaC), QA was involved with our Test Driven Development (TDD) strategy and Continuous Integration (CI) pipelines, and Architects helped out with development and troubleshooting.
2. Embrace Test-Driven Development
Everyone hates big-bang releases, which causes problems with discovering late integration issues, refactoring complex solutions, and possible product vision divergence.
To not fall into these pitfalls, we opted for test-driven development (TDD). TDD allowed us to break down, implement, test, review, and expand complex solutions while always getting feedback from the Product Owner (PO) as we went along building the product. This iterative approach and feedback loop gave us the ability to continue improving a feature after establishing a strong foundation, which is the first principle in the Agile Manifesto (Kent Beck et al., 2001). The most important consideration to keep in mind when adopting a DevOps approach is to make sure that the team does not tie themselves emotionally to their implementation since it might be there one day but gone the next.
By opting for a TDD approach, we implemented complex problems with non-over-engineered solutions. TDD is an iterative approach to developing features making refactoring easier to achieve while also adding quality to the solution. “Start somewhere and learn from experience” (John Shook. 2008. Managing to Learn: Using the A3 Management Process to Solve Problems, Gain Agreement, Mentor, and Lead).
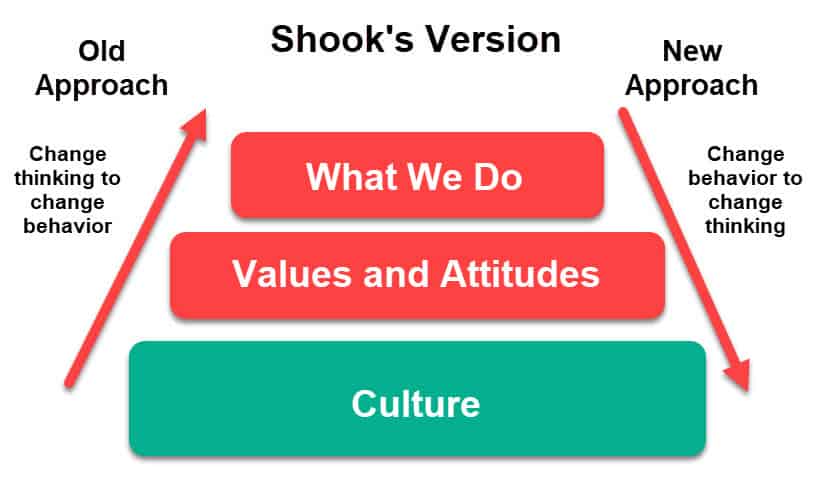
3. Push the DevOps Culture Change
Introducing culture change is not just hard. It’s exhausting, frustrating, and demoralizing. Pushing a different mindset in a multi-structural organization is a lot harder than building a company culture within a startup.
That is why I believe change can be achieved by treating them in the same manner. If you are trying to build a different implementation methodology within an already established company, it is achievable only if you create a mini organization ecosystem. Form team structures that the company will perceive as a startup when implementing a new project.
You will be faced with restraints, such as “That’s not how we do things” or “We already have different tools for that.” If you hear those statements, you are on the right track. Questioning the company’s processes and tools is the first thing you need to do when proposing a culture change. Consider whether the existing tools and methods are relevant at all.
In our case, by questioning, we were able to leverage Cloud Native technologies as opposed to systems that the company had considered as ‘standard.’ You will not have buy-in from everyone in pushing the DevOps change. However, having support from top executives is critical. It will help motivate people within the company who are less open to change since the vision is supported by higher up management.
4. Test Your Progress
Test the progress of your efforts at various DevOps transition stages.
Start by testing the velocity. You want to be agile and implement solutions quickly. By comparing the ‘startup’ project to other ongoing or historical solutions, you should be able to know whether the DevOps team is delivering faster. It is also essential to gauge the team’s ability to adapt to change. If changes from the feedback loop turn out to be an overhaul of the system, then something went wrong during the design stage.
Secondly, measure success by analyzing the team’s morale. People should be excited and motivated when a new adaptation of implementation is introduced. You will realize that you have achieved this by overhearing someone from the team talking to somebody outside the team, explaining how we managed to solve a problem using the new mentality or technology, which is new to the company. This will spark interest from other teams and, it’s at that point that you’ll realize that the culture change is spreading throughout the organization. Consider that the real measure of success – the new DevOps methodology gets noticed. Other team members want to try out things differently and come to you for advice on how to tackle problems using DevOps solutions.
Learn more about DevOps Metrics and KPIs you should be tracking.
5. Be Uncompromising
When I took on the role of SCRUM Master, I knew I had to deliver a new product and a DevOps culture change as fast as possible. It was imperative to keep both goals aligned throughout the product development phase. When faced with such challenges, buy-in and trust from executives can make or break a culture change. At times, management might not concern themselves about how a project is achieved as long as it’s delivered – even if we have to fall back onto an outdated technology.
That brings me to my next point, start with a blank canvas. Do not try to fit the current company standards into a DevOps way of developing software. Start from scratch and maintain a lean solution. Let the team research the best tools for solving a problem. If they identify a solution that the company is already using, all well and good. If they don’t, then present the new tool to whoever champions the current solution to get their buy-in to changing it. Ensure the team keeps in mind that nothing is set in stone, tools can change, someone might have a better idea, and requirements can change; it’s iterative.

phoenixNAP is a global IT services provider offering IaaS, including Bare Metal and Cloud services, as well as Colocation and Disaster Recovery solutions. Peter's DevOps team developed phoenixNAP's latest product - Bare Metal Cloud. It provides our clients the ability to provision servers swiftly with automation tools, and implement an infrastructure-as-code approach.
6. Transition Other Teams to DevOps
Once the DevOps culture change within this micro organization starts to bear fruit, you need to consider the next step – growth.
How to transition more teams to DevOps?
The Toyota Production System (TPS) philosophy (Toshiko Narusawa & John Shook. 2009. Kaizen Express) seems to fall in line with Spotify’s Agile Scaling model. Maintaining an organization structure that is as flat and self-contained as possible is key. That empowers teams, making them more accountable for their successes and failures. Instead of forming departments of same-skilled people, set up ‘Chapters’ where these members form part of SCRUM teams and encourage them to liaise with each other to help solve problems. Promoting constant communication retains the project priority within the team..
Set up knowledge-sharing events to inform other departments about any technical decisions the team has taken. Knowledge sharing will help drive a company-wide transition to DevOps and rally up support across the whole organization. We’ve learned a lot over the past year, and we are continually looking for ways to improve our processes and structure through different iterations. Retaining the mentality of being lean and agile and ensuring the product is a success story will be the most important factors to maintain.
Final Advice on Switching to Devops
The last and most crucial point for anyone transitioning to DevOps is never to give up. There will be times when you will think that embracing a DevOps culture is hard to achieve, but if you have the right support system, from the team, management, and executives, you will get there. A day will come when someone from another team will request a meeting wanting to know how you implemented something.
That’s when you realize that the company is on the right track to accepting a DevOps culture. Spread the philosophy from one team to another, in phases, and take your time to move the entire organization to DevOps.
Test Driven vs Behavior Driven Development: Key Differences
Test-driven development (TDD) and Behavior-driven development (BDD) are both test-first approaches to Software Development. They share common concepts and paradigms, rooted in the same philosophies. In this article, we will highlight the commonalities, differences, pros, and cons of both approaches.
What is Test-driven development (TDD)
Test-driven development (TDD) is a software development process that relies on the repetition of a short development cycle: requirements turn into very specific test cases. The code is written to make the test pass. Finally, the code is refactored and improved to ensure code quality and eliminate any technical debt. This cycle is well-known as the Red-Green-Refactor cycle.
What is Behavior-driven development (BDD)
Behavior-driven development (BDD) is a software development process that encourages collaboration among all parties involved in a project’s delivery. It encourages the definition and formalization of a system’s behavior in a common language understood by all parties and uses this definition as the seed for a TDD based process.
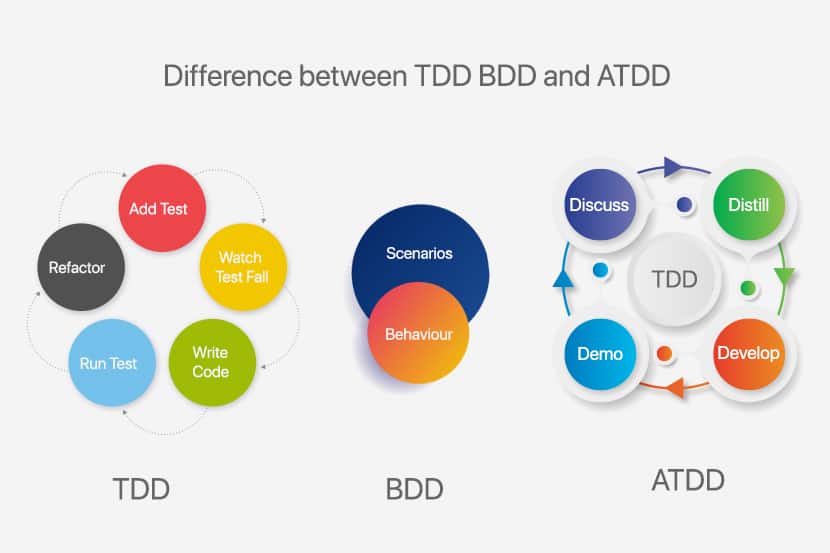
Key Differences Between TDD and BDD
| TDD | BDD | |
| Focus | Delivery of a functional feature | Delivering on expected system behavior |
| Approach | Bottom-up or Top-down (Acceptance-Test-Driven Development) | Top-down |
| Starting Point | A test case | A user story/scenario |
| Participants | Technical Team | All Team Members including Client |
| Language | Programming Language | Lingua Franca |
| Process | Lean, Iterative | Lean, Iterative |
| Delivers | A functioning system that meets our test criteria | A system that behaves as expected and a test suite that describes the system’s behavior in human common-language |
| Avoids | Over-engineering, low test coverage, and low-value tests | Deviation from intended system behavior |
| Brittleness | Change in implementation can result in changes to test suite | Test suite-only needs to change if the system behavior is required to change |
| Difficulty of Implementation | Relatively simple for Bottom-up, more difficult for Top-down | The bigger learning curve for all parties involved |
Test-Driven Development (TDD)
In TDD, we have the well-known Red-Green-Refactor cycle. We start with a failing test (red) and implement as little code as necessary to make it pass (green). This process is also known as Test-First Development. TDD also adds a Refactor stage, which is equally important to overall success.
The TDD approach was discovered (or perhaps rediscovered) by Kent Beck, one of the pioneers of Unit Testing and later TDD, Agile Software Development, and eventually Extreme Programming.
The diagram below does an excellent job of giving an easily digestible overview of the process. However, the beauty is in the details. Before delving into each individual stage, we must also discuss two high-level approaches towards TDD, namely bottom-up and top-down TDD.
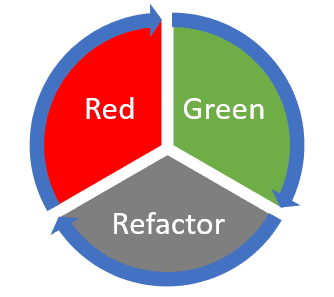
Bottom-Up TDD
The idea behind Bottom-Up TDD, also known as Inside-Out TDD, is to build functionality iteratively, focusing on one entity at a time, solidifying its behavior before moving on to other entities and other layers.
We start by writing Unit-level tests, proceeding with their implementation, and then moving on to writing higher-level tests that aggregate the functionalities of lower-level tests, create an implementation of the said aggregate test, and so on. By building up, layer by layer, we will eventually get to a stage where the aggregate test is an acceptance level test, one that hopefully falls in line with the requested functionality. This process makes this a highly developer-centric approach mainly intended at making the developer’s life easier.
| Pros | Cons |
| Focus is on one functional entity at a time | Delays integration stage |
| Functional entities are easy to identify | Amount of behavior an entity needs to expose is unclear |
| High-level vision not required to start | High risk of entities not interacting correctly with each other thus requiring refactors |
| Helps parallelization | Business logic possibly spread across multiple entities making it unclear and difficult to test |
Top-Down TDD
Top-Down TDD is also known as Outside-In TDD or Acceptance-Test-Driven Development (ATDD). It takes the opposite approach. Wherein we start building a system, iteratively adding more detail to the implementation. And iteratively breaking it down into smaller entities as refactoring opportunities become evident.
We start by writing an acceptance-level test, proceed with minimal implementation. This test also needs to be done incrementally. Thus, before creating any new entity or method, it needs to be preceded by a test at the appropriate level. We are hence iteratively refining the solution until it solves the problem that kicked off the whole exercise, that is, the acceptance-test.
This setup makes Top-Down TDD a more Business/Customer-centric approach. This approach is more challenging to get right as it relies heavily on good communication between the customer and the team. It also requires good citizenship from the developer as the next iterative step needs to come under careful consideration. This process will speed-up in time but does have a learning curve. However, the benefits far outweigh any negatives. This approach results in the collaboration between customer and team taking center stage, a system with very well-defined behavior, clearly defined flows, focus on integrating first, and a very predictable workflow and outcome.
| Pros | Cons |
| Focus is on one user requested scenario at a time | Critical to get the Assertion-Test right thus requiring collaborative discussion between business/user/customer and team |
| Flow is easy to identify | Relies on Stubbing, Mocking and/or Test Doubles |
| Focus is on integration rather than implementation details | Slower start as the flow is identified through multiple iterations |
| Amount of behavior an entity needs to expose is clear | More limited parallelization opportunities until a skeleton system starts to emerge |
| User Requirements, System Design and Implementation details are all clearly reflected in the test suite | |
| Predictable |
The Red-Green-Refactor Life Cycle
Armed with the above-discussed high-level vision of how we can approach TDD, we are free to delve deeper into the three core stages of the Red-Green-Refactor flow.
Red
We start by writing a single test, execute it (thus having it fail) and only then move to the implementation of that test. Writing the correct test is crucial here, as is agreeing on the layer of testing that we are trying to achieve. Will this be an acceptance level test or a unit level test? This choice is the chief delineation between bottom-up and top-down TDD.
Green
During the Green-stage, we must create an implementation to make the test defined in the Red stage pass. The implementation should be the most minimal implementation possible, making the test pass and nothing more. Run the test and watch it pass.
Creating the most minimal implementation possible is often the challenge here as a developer may be inclined, through force of habit, to embellish the implementation right off the bat. This result is undesirable as it will create technical baggage that, over time, will make refactoring more expensive and potentially skew the system based on refactoring cost. By keeping each implementation step as small as possible, we further highlight the iterative nature of the process we are trying to implement. This feature is what will grant us agility.
Another key aspect is that the Red-stage, i.e., the tests, is what drives the Green-stage. There should be no implementation that is not driven by a very specific test. If we are following a bottom-up approach, this pretty much comes naturally. However, if we’re adopting a top-down approach, then we must be a bit more conscientious and make sure to create further tests as the implementation takes shape, thus moving from acceptance level tests to unit-level tests.
Refactor
The Refactor-stage is the third pillar of TDD. Here the objective is to revisit and improve on the implementation. The implementation is optimized, code quality is improved, and redundancy eliminated.
Refactoring can have a negative connotation for many, being perceived as a pure cost, fixing something improperly done the first time around. This perception originates in more traditional workflows where refactoring is primarily done only when necessary, typically when the amount of technical baggage reaches untenable levels, thus resulting in a lengthy, expensive, refactoring effort.
Here, however, refactoring is an intrinsic part of the workflow and is performed iteratively. This flexibility dramatically reduces the cost of refactoring. The code is not entirely reworked. Instead, it is slowly evolving. Moreover, the refactored code is, by definition, covered by a test. A test that has already passed in a previous iteration of the code. Thus, refactoring can be done with confidence, resulting in further speed-up. Moreover, this iterative approach to improvement of the codebase allows for emergent design, which drastically reduces the risk of over-engineering the problem.
It is of critical importance that behavior should not change, and we do not add extra functionality during the Refactor-stage. This process allows refactoring to be done with extreme confidence and agility as the relevant code is, by definition, already covered by a test.
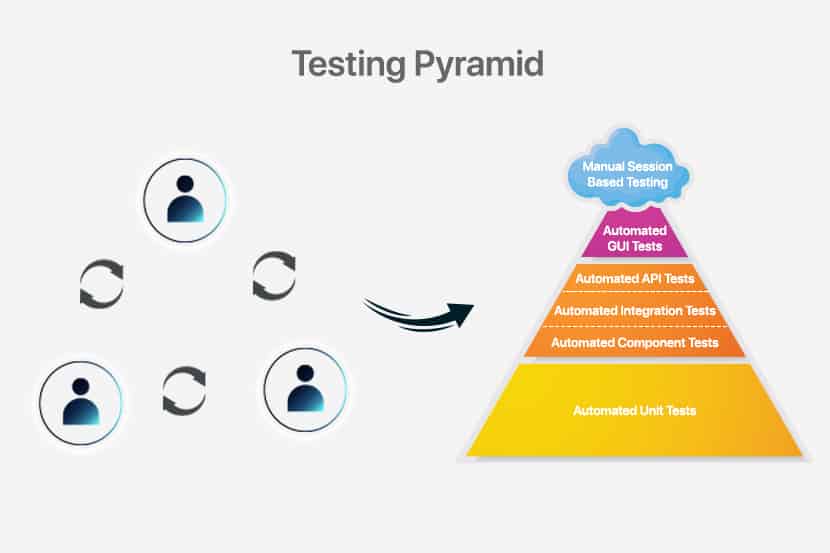
Behavior-Driven Development (BDD)
As previously discussed, TDD (or bottom-up TDD) is a developer-centric approach aimed at producing a better code-base and a better test suite. In contrast, ATDD is more Customer-centric and aimed at producing a better solution overall. We can consider Behavior-Driven Development as the next logical progression from ATDD. Dan North’s experiences with TDD and ATDD resulted in his proposing the BDD concept, whose idea and the claim was to bring together the best aspects of TDD and ATDD while eliminating the pain-points he identified in the two approaches. What he identified was that it was helpful to have descriptive test names and that testing behavior was much more valuable than functional testing.
Dan North does a great job of succinctly describing BDD as “Using examples at multiple levels to create shared understanding and surface certainty to deliver software that matters.”
Some key points here:
- What we care about is the system’s behavior
- It is much more valuable to test behavior than to test the specific functional implementation details
- Use a common language/notation to develop a shared understanding of the expected and existing behavior across domain experts, developers, testers, stakeholders, etc.
- We achieve Surface Certainty when everyone can understand the behavior of the system, what has already been implemented and what is being implemented and the system is guaranteed to satisfy the described behaviors
BDD puts the onus even more on the fruitful collaboration between the customer and the team. It becomes even more critical to define the system’s behavior correctly, thus resulting in the correct behavioral tests. A common pitfall here is to make assumptions about how the system will go about implementing a behavior. This mistake occurs in a test that is tainted with implementation detail, thus making it a functional test and not a real behavioral test. This error is something we want to avoid.
The value of a behavioral test is that it tests the system. It does not care about how it achieves the results. This setup means that a behavioral test should not change over time. Not unless the behavior itself needs to change as part of a feature request. The cost-benefit over functional testing is more significant as such tests are often so tightly coupled with the implementation that a refactor of the code involves a refactor of the test as well.
However, the more substantial benefit is the retention of Surface Certainty. In a functional test, a code-refactor may also require a test-refactor, inevitably resulting in a loss of confidence. Should the test fail, we are not sure what the cause might be: the code, the test, or both. Even if the test passes, we cannot be confident that the previous behavior has been retained. All we know is that the test matches the implementation. This result is of low value because, ultimately, what the customer cares about is the behavior of the system. Thus, it is the behavior of the system that we need to test and guarantee.
A BDD based approach should result in full test coverage where the behavioral tests fully describe the system’s behavior to all parties using a common language. Contrast this with functional testing were even having full coverage gives no guarantees as to whether the system satisfies the customer’s needs and the risk and cost of refactoring the test suite itself only increase with more coverage. Of course, leveraging both by working top-down from behavioral tests to more functional tests will give the Surface Certainty benefits of behavioral testing. Plus, the developer-focused benefits of functional testing also curb the cost and risk of functional testing since they’re only used where appropriate.
In comparing TDD and BDD directly, the main changes are that:
- The decision of what to test is simplified; we need to test the behavior
- We leverage a common language which short-circuits another layer of communication and streamlines the effort; the user stories as defined by the stakeholders are the test cases
An ecosystem of frameworks and tools emerged to allow for common-language based collaboration across teams. As well as the integration and execution of such behavior as tests by leveraging industry-standard tooling. Examples of this include Cucumber, JBehave, and Fitnesse, to name a few.
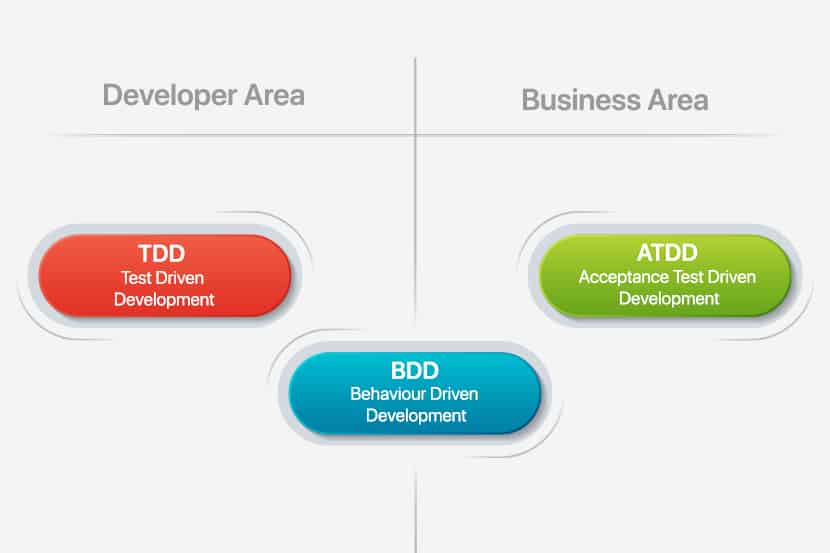
The Right Tool for the Job
As we have seen, TDD and BDD are not really in direct competition with each other. Consider BDD as a further evolution of TDD and ATDD, which brings more of a Customer-focus and further emphasizes communication between the customer and the Technical team at all stages of the process. The result of this is a system that behaves as expected by all parties involved, together with a test suite describing the entirety of the system’s many behaviors in a human-readable fashion that everyone has access to and can easily understand. This system, in turn, provides a very high level of confidence in not only the implemented system but in future changes, refactors, and maintenance of the system.
At the same time, BDD is based heavily on the TDD process, with a few key changes. While the customer or particular members of the team may primarily be involved with the top-most level of the system, other team members like developers and QA engineers would organically shift from a BDD to a TDD model as they work their way in a top-down fashion.
We expect the following key benefits:
- Bringing pain forward
- Onus on collaboration between customer and team
- A common language shared between customer and team-leading to share understanding
- Imposes a lean, iterative process
- Guarantee the delivery of software that not only works but works as defined
- Avoid over-engineering through emergent design, thus achieving desired results via the most minimal solution possible
- Surface Certainty allows for fast and confident code refactors
- Tests have innate value VS creating tests simply to meet an arbitrary code coverage threshold
- Tests are living documentation that fully describes the behavior of the system
There are also scenarios where BDD might not be a suitable option. There are situations where the system in question is very technical and perhaps is not customer-facing at all. It makes the requirements more tightly bound to the functionality than they are to behavior, making TDD a possibly better fit.
Adopting TDD or BDD?
Ultimately, the question should not be whether to adopt TDD or BDD, but which approach is best for the task at hand. Quite often, the answer to that question will be both. As more people are involved in more significant projects, it will become self-evident that both approaches are needed at different levels and at various times throughout the project’s lifecycle. TDD will give structure and confidence to the technical team. While BDD will facilitate and emphasize communication between all involved parties and ultimately delivers a product that meets the customer’s expectations and offers the Surface Certainty required to ensure confidence in further evolving the product in the future.
As is often the case, there is no magic bullet here. What we have instead is a couple of very valid approaches. Knowledge of both will allow teams to determine the best method based on the needs of the project. Further experience and fluidity of execution will enable the team to use all the tools in its toolbox as the need arises throughout the project’s lifecycle, thus achieving the best possible business outcome. To find out how this applies to your business, talk to one of our experts today.

5 Automated Security Testing Best Practices
Tech companies suffered countless cyber-attacks and data breaches in 2019 due to ‘compromised’ applications. Security defects in the code are now common occurrences because of rapid software development. Therefore, conducting traditional security tests do not suffice to provide full-proof protection against such attacks.
In the software world, there has never been a better time to integrate Application Security Tools into the Software Development Life Cycle (SDLC) mainly to lend support to development teams with regular and continuous security testing.
What is Automated Security Testing?
Automated testing is a practice (Read: tool) to reveal potential flaws or weaknesses during software development. Automated testing occurs throughout the software development process and does not negatively affect development time. The entire automated security testing process ensures that applications you are developing deliver the expected results and reveal any programming errors in the beginning.
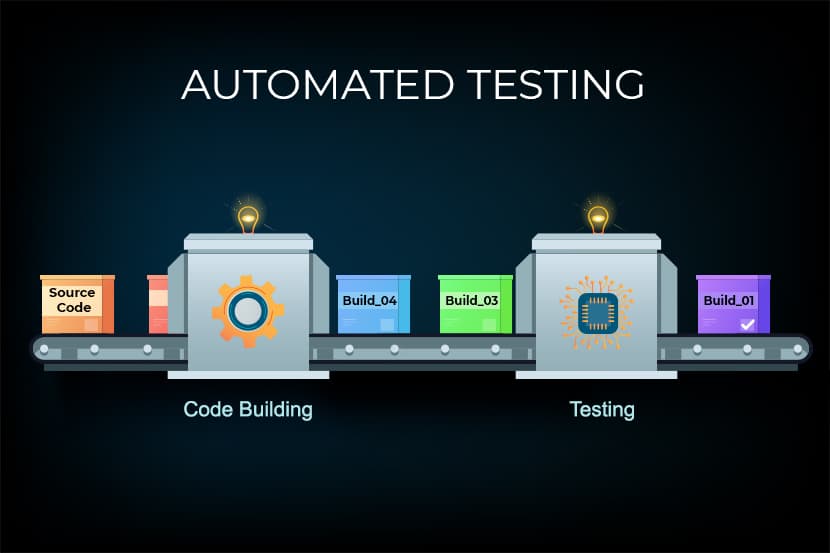
Before we go further, do you know that almost 40% of all significant software testing is now automated?
Despite this, a significant amount of testing nowadays is conducted manually and at the development cycle’s final stages. Why? Because a large number of developers at the companies are not well-equipped to develop automated test strategies. The advantage of automated testing when developing software internally or for production is that you can use it to reveal potential weaknesses and flaws without slowing the development time.
DevSecOps
DevSecOps refers to an emerging discipline in this field. As software companies branch into new sectors such as wearables and IoT, there is a need for a thorough audit of all the current tools to combat security issues that may arise during the development process.
In this article, we are listing the general process and best practices of automated security testing.
-
Conducting a Software Audit:
The first step in automated security testing should begin with a complete audit of the software. During the audit, companies can quickly discover any significant risks emerging from the product. It is also the best way to integrate automation seamlessly into a client’s current workflow.
-
Seeking out Opportunities for Automation:
Since the past few years, companies are facing a strong push towards the automation of routine, repetitive, and mundane tasks. This wave of automation has come to the software testing world as well. In general practice, some primary factors determine if the company should automate a specific task or not. Factors like
If the tasks are straightforward: The very basic factor is the simplicity of the task. The Automation process should start with the simplest tasks available and slowly move towards covering more complex tasks. In companies, all complex tasks, at some point, still need human interaction. Some of the simple tasks include file and database system interactions.
If the tasks are repetitive and mundane: Automation is also ideal for those frequent tasks that are mundane and repetitive. With automated testing processes, you can also repeat a multitude of programmed actions to ensure the program’s consistency.
If the process is data-intensive: Automation is also helpful to comb through large volumes of data at once in an efficient and timely manner, making it ideal for data-intensive processes. To ensure that the correct use of data, testers can also use special automation tools to perform tests with even overwhelming sets of data.
Companies usually perform automated testing on some specific areas of software testing. Those areas include:
- Tools for code analysis: Code analysis tools can secure DevOps efforts, which automatically scan codes and identify any vulnerabilities present within the code itself. As a result, software teams receive some invaluable information while they work and identify problems before the quality assurance team.
- Scanning for appropriate configurations: Certain software tools can ensure the correct configuration of applications to use in specific environments, such as mobile environments or web-based environments.
- Application-level testing: During application-level testing, scanners such as OWASP Zap and Burb Intruder can also ensure that applications are not carrying out any malicious actions.
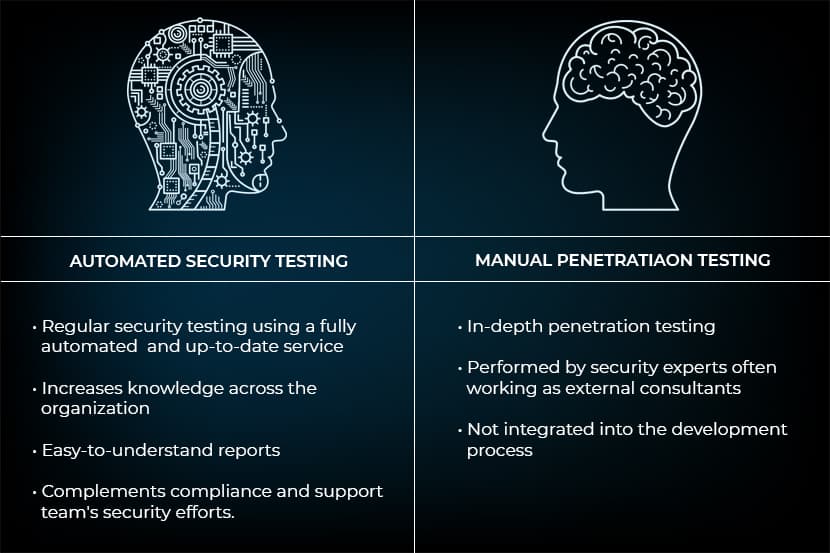
Bringing the Team on Board
Software teams are traditionally reluctant to integrate automation into their testing process. Why? Apart from the fear of change, the biggest reason is their wrong perception of the results’ accuracy. Many developers also consider automated testing more costly and time-consuming.
Automated security testing is NOT a replacement for manual testing in terms of accuracy. It is only a practice to automate the most mundane, tedious, and repetitive tasks in the testing processes.
Some issues that come up in automation do exist. These are risks in which a human needs to determine the logic that a computer would need to see the flaw. As an example, a system that gives every user permissions to modify and edit all files freely.
An automated system would have no way of knowing what the intended behavior is, nor would it have any idea of understanding the risk that this implies. This is where humans are introduced to the process.
It’s also why automated security testing should not replace manual testing, which is the only way to ensure thoroughness and accuracy.
Instead, it’s intended to automate the most tedious, mundane, and repetitive tasks associated with testing. Through this, the programming team can have more time to test the areas of the solution that requires manual testing, such as the program’s internal logic.
Another common issue with the software teams is the overestimation of the required time to develop an automated process. Modern software testing systems are not overly expensive or time-consuming owing to the number of frameworks and APIs available. The key is to find out what works for your organization or not, and that will ultimately save the organization time, money, and resources.
Selecting the Right Automation Tools
When choosing to automate the software testing process, developers have a myriad of choices to choose from, both commercial as well as open-source solutions. While Open source solutions are robust and have a well-maintained framework, they sometimes lack the advanced technology or customer service that comes with a commercial solution. Some of those tools are.
- Contrast Security: Contract Security is a runtime application security tool that runs inside applications to identify any potential faults.
- Burp Intruder: Burp Intruder is an infrastructure scanner, used to ensure whether applications are interacting correctly with the environment.
- OWASP ZAP: OWASP ZAP is an infrastructure scanner which is open-source in nature. It functions similarly to Burp Intruder.
- Veracode: Veracode refers to a code analysis tool to find vulnerabilities within an application structure.
- BDD Security: BDD Security is a test automation framework where users can employ natural language syntax to describe security functions as features.
- Mittn: Mittn is an open-source test automation framework that uses the Python programming language.
- Microsoft Azure Advisor: Microsoft Azure advisor is a cloud-based consultant service that provides recommendations according to an individual’s requirements.
- GauntIT: GauntIT is a test automation framework, ideal for those accustomed with Ruby development.
Depending on the company’s automation strategy, it may have to create custom scripting for their automation processes. The company’s network can use ‘Custom Scripting’ to make it more lightweight, customized, and optimized.
Custom scripting has the benefit of being tailored to your network security threats. However, it can be a hefty-cost solution, also requiring an internal development team. To make sure you choose the right solution for your needs, consider following the process in the image below:
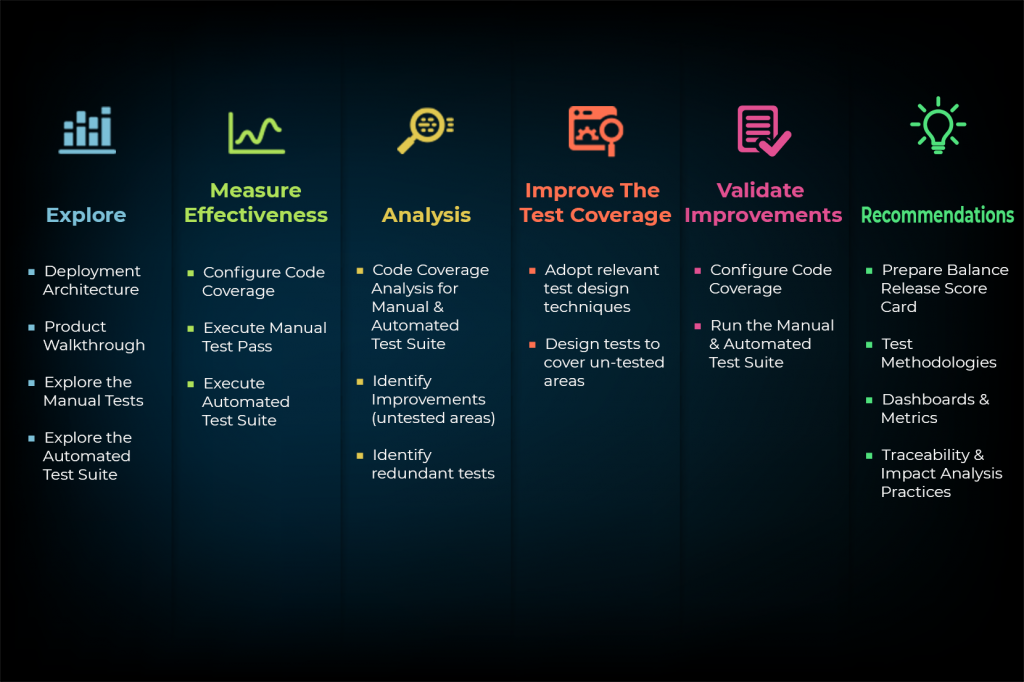
Integrating Automated Testing Processes
The integration of automated testing processes to a company’s product pipeline is an iterative process. During the software development phase, there is continuous testing to find out potential risks and flaws. Processes like these ensure that the potential vulnerabilities do not remain unaddressed.
A significant chunk of the security-related testing occurs in the later stages of the production cycle, causing issues and delays to the product and the company. However, if the companies perform consistent testing, it leads to a more thoroughly secured product and avoids last-minute delays before release.
Breaking Large Projects into Smaller Steps
When working with large intensive projects, DevSecOps works well if the project consists of smaller, manageable steps. Instead of automating the entire solution at once, the formation of smaller automated processes within the larger production cycle leads to a better result.
Following this process would not only avoid any hiccups within the development cycle but also give developers the required time to adjust to newer automation standards. To acclimatized developers to the latest standards and to ensure training is in-depth and non-disruptive, introducing new tools one by one is also a good practice to follow.
Checking for Code Dependencies
The days of in-house coding has vanished mainly as most organizations do not develop codes in-house. They tend to use many third-party open-source codes for each application, which has some significant vulnerabilities. Organizations are thus required to automate their processes after identifying the code dependencies, ensuring that third-party code has no known vulnerabilities.
Testing against Malicious Attacks
Due to the rise of the rate of cybercrimes, applications should go through rigorous testing to prevent denial of service attacks (DDoS) and other malicious attacks. Broken solutions reveal some particular vulnerabilities, and this is why it is essential to conduct stringent tests on the application under challenging circumstances.
Organizations are seeing an increasing number of malicious attacks. These attacks may focus on any aspect of a client’s organization that is accessible from outside of the network. By regularly testing your application under particularly strenuous circumstances, you can secure it through various scenarios.
Training Development Team in Best Practices
In-depth training of programmers is also vital to avoid already identified vulnerabilities and flaws from occurring again in later production cycles. It is a proactive approach to make applications more inherently secure. This simple approach does not only improve the consistency of the product, but it also avoids costly modifications, if you discover flaws at the later stage.
As you identify vulnerabilities and flaws within your software solutions, programmers will need the training to avoid these issues in further production cycles.
Though the process of identifying issues is automated, the problems that are found should still be logged for the benefit of upcoming projects and future versions of the product. By training programmers proactively, an organization can, over time, make their applications more inherently secure.
Not only does this improve the consistency of the end product, but it also avoids costly modifications when flaws are discovered and require mitigation. Via training and company-wide messaging, developers can be trained on coding more securely.
If developers do not become apprised of issues, the same mistakes will continue to happen. Automated testing will not be as effective as it could be. It isn’t just cheaper and faster than manual testing; it’s also more consistent. Every test will run identically on each application and in each environment.
By automatically testing applications and identifying lax policies, the software life cycle for both on-premise and cloud-based web applications becomes shorter.
Through the years, organizations have still been manually testing their software security in-house or by professionals. However, by implementing automated testing as a standard practice, they can streamline their product deployment process to a high degree, reducing the overheads associated with the process. Regular training ensures that software teams are incorporating automation best practices into their processes.
Choosing Automated over Manual Testing
Automated testing is not only cheaper and faster than manual testing, but it is also much more consistent. It doesn’t make mistakes as each test runs identically on different applications and environments, and that can save you both time and money. Keeping manual tests in place only where human assessment is needed also conserves your company’s human resources.
To implement automated testing, organizations will require large-scale efforts to promote and apply best practices throughout their projects. Including training their software teams so they can incorporate it into their respective processes seamlessly. Need more detailed advice on how to automate security testing? Reach out to one of our experts today.
What is DevSecOps? Best Practices for Adoption
Software applications are the backbone of many industries. They power many businesses and essential services. A security lapse or failure in such an application can result in financial loss, as well as a tarnished reputation. In some extreme cases, it can even result in loss of life.
What is DevSecOps?
DevSecOps is the method that integrates security practices within the DevOps process. It creates and promotes a collaborative relationship between security teams and release engineers based on a ‘Security as Code’ philosophy. DevSecOps has gained popularity and importance, given the ever-increasing security risks to software applications.
DevSecOps integrates security within your product pipeline in an iterative process. It thoroughly incorporates security with the rest of the DevOps approach.
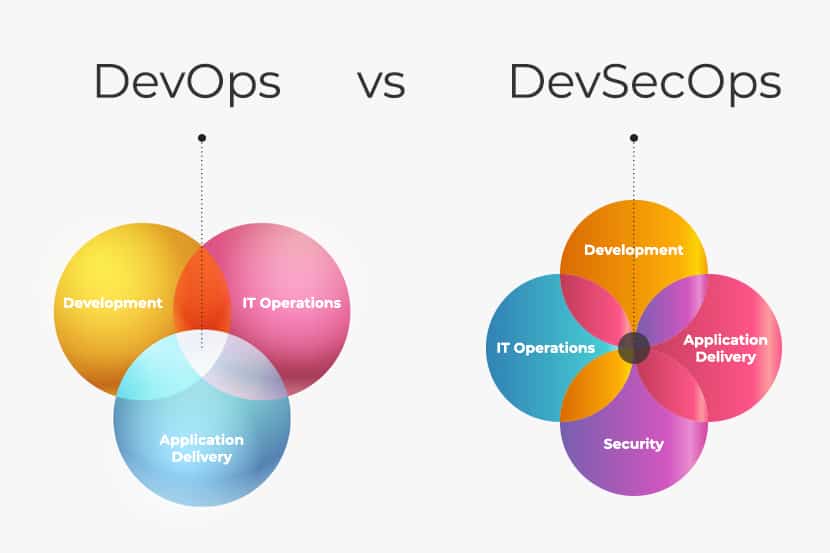
As teams develop software, testing for potential security risks and flaws is critical. Security teams must address issues before the solution can move ahead. This iterative process will ensure that vulnerabilities do not go unaddressed.
As DevSecOps is still a new and emerging discipline, it may require some time to gain mainstream acceptance and integration. A significant amount of security tests take place late in the production cycle. This delay can cause major issues for companies and their products. As security is usually is one of the last features considered in the development process. If you keep security at the end of the development pipeline, when security issues come up near launch, then you will find yourself back at the start of long development cycles.
When security concerns are raised late in the production cycle, teams will have to make significant changes to the solution before rolling it out. An interruption in production will ultimately lead to a delay in deliverables. Thus, ignoring security issues can lead to security debt later in the lifecycle of the product. This is an outdated security practice and can undo the best DevOps initiatives. So the DevSecOps goal is to begin the security team’s involvement as early as possible in the development lifecycle.
How Does DevSecOps Work?
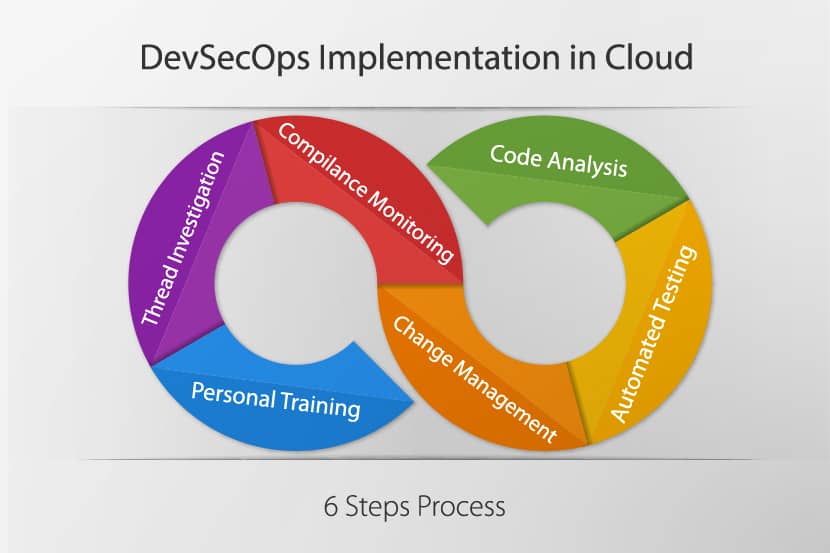
The DevSecOps method needs development and operations teams to do more than just collaborate. Security teams also need to join in at an early stage of the iteration to ensure overall software security, from start to end. You need to think about infrastructure and application security from the start.
Not only does consistent testing lead to secure code, but it also avoids last-minute delays by spreading the work predictably and consistently throughout the project. Through this process, organizations can better achieve their deadlines and ensure that their customers and end-users are satisfied.
IT security needs to play an integrated role in your applications’ full life cycle. You can take advantage of the responsiveness and agility of a DevOps approach by the incorporation of security into your processes.
The primary areas of software security testing are being adopted:
Application security testing
As software applications are run, solutions can scan the application to ensure that malicious actions are not being taken. Scanners such as Burb Intruder and OWASP Zap automation will test and examine applications, to ensure that they aren’t taking steps that could be perceived as malicious by end-users.
Scanning for the appropriate configurations
Software tools can be designed to ensure that the application is configured correctly and secured for use in specific environments, such as the Microsoft Azure Advisor tool for cloud-based infrastructure. Many automated testing tools are designed to operate in a particular environment, such as a mobile environment or web-based environment. During the development of software, it can be ensured that the software is being built to these appropriate standards.
Code analysis tools
Code analysis tools can strengthen DevOps security efforts by automatically scanning the code and identifying potential and known vulnerabilities within the code itself. This can be invaluable information as the software teams work, as they will be able to identify problems before they are caught in quality assurance. This can also help them in developing better coding habits.
DevSecOps Best Practices
DevSecOps integrates security into the development lifecycle, but it is not possible to do so hastily and without planning. Include it in the design and development stages. Companies can work to change their workflows by following some of the best practices of the industry.
Get your teams on board
It may seem trivial, but getting all the required teams working together can make a huge difference in your DevSecOps initiative. Development teams are familiar with the typical process of handing off newly released iterations to Quality Assurance teams. This isolated behavior is the norm in companies that have each team in a silo.
Companies should eliminate silos and bring development, operations, and security teams together. Unity across teams will enable the experts in these groups to work together from the beginning of the development process and foresee any challenges.
Threat modeling is one way to plan for and identify possible security threats to your assets. You examine the types and sensitivities of your assets and analyze existing controls in place to protect those assets. By identifying the gaps you can address them before they become an active problem.
These types assessments can help identify flaws in the architecture and design of your applications that other security approaches might have missed.
The first step in implementing a DevSecOps culture is to educate your teams that security is a shared responsibility of teams from all three disciplines. Once development and operations teams take on the shared responsibility of securing code and infrastructure, DevSecOps becomes a natural part of the development cycle.

Many DevOps teams still have the misconception that security assessment causes delays in software development and that there should be a trade-off between security and speed. DevSecOps events and training are excellent opportunities to rid teams of these misconceptions. Real-life examples and case studies can help to get buy-in from teams and management alike.
Educate your developers
Developers are almost single-handedly responsible for the quality of the code they develop. Coding errors are the cause of many security vulnerabilities and issues. But companies pay little attention to their developers’ training and skill enhancement when it comes to producing secure code.
Educating them in the best practices of coding can directly contribute to improved code quality. Better code quality leaves less room for security vulnerabilities. Security teams will also find it easier to assess and remedy any vulnerabilities in high-quality code.
‘Common software weaknesses’ is another area in which most developers are unfamiliar. Teams can use online tools like the Common Weakness Enumeration list as a reference. Listings are useful to developers who are not that familiar with security practices.
Security teams, as part of their commitment to DevSecOps, must undertake to train development and operations teams regarding security practices. Such training will enable developers to integrate security controls into the code.
Compliance (HIPAA, GDPR, PCI) is vital for applications in industries such as finance and medicine. Development teams must be familiar with these standards and keep in mind the requirements to ensure compliance.
Verify code dependencies
Very few organizations today develop their code all in-house. It is more likely that each application will be built on a large amount of third-party, open-source code.
Despite the risk, many companies use third-party software components and open-source software in applications instead of developing from scratch. Yet they lack the automatic identification and remediation tracking for bugs and flaws that may exist in open-source software. Due to the pressure of meeting customer demands developers rarely have the opportunity to review code or documentation.
This is where automated testing plays a significant role in regularly test open-source and third-party components. It’s a main requirement in the DevSecOps methodology. It’s critical to find out if open-source usage is causing any weaknesses or vulnerabilities in your code. You need to find out how it impacts dependent code. It will help you identify issues that help reduce the meantime to resolution.
Third-party code can represent some significant vulnerabilities. Organizations will need to identify their code dependencies and automate the process of ensuring that their third-party code has no known vulnerabilities and is being updated as it should be throughout the process of creation.
There are utilities available that can continuously check a database of known vulnerabilities to quickly identify any issues with existing code dependencies. This software can be used to swiftly mitigate third-party threats before they are incorporated into the application.
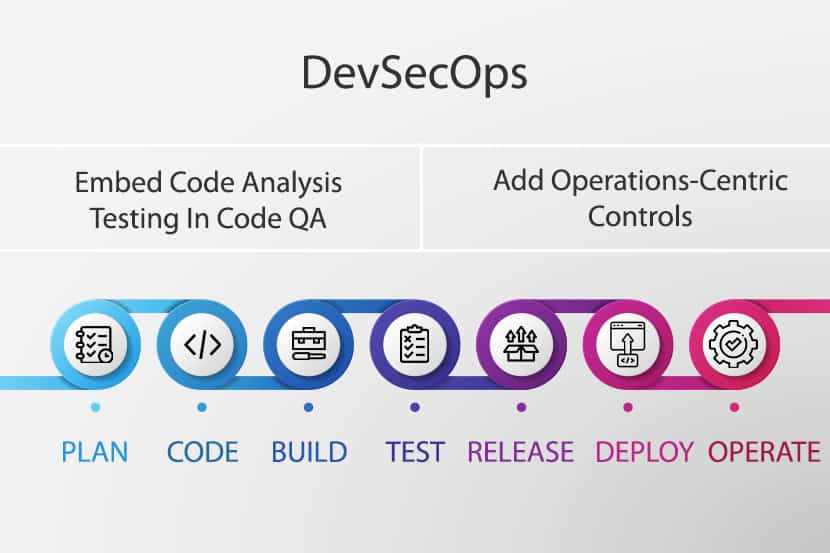
Enhance Continuous Integration with DevOps Security
DevOps teams typically use Continuous Integration (CI) tools to automate parts of the development cycle, such as testing and building. These are routine tasks that teams need to repeat with each release.
Enhancing Continuous Integration processes and tools with security controls ensures that security practitioners identify issues before validating builds for Continuous Delivery (CD). CI also reduces the time spent on each iteration.
For example, using (SAST) static application security testing on daily builds will help you ensure that you’re only scanning for instances or items of interest in the changes to your code that were committed that day.
DevSecOps teams need to use vulnerability assessment scanning tools to ensure that they identify security issues early in the development cycle. They can use pre-production systems for this type of testing.
Simplify your code
Simpler code is easier to analyze and fix. Developers will find debugging their code much easier when it is simple and easier to read. Simple and clean code will also lead to reduced security issues. Developers will be able to quickly review and work on each other’s code if it is simple.
More significantly, security teams will be able to analyze simple code more efficiently. So releasing code in smaller chunks will allow security teams to identify issues sooner and with less effort. By choosing one section to analyze and prove it works, before moving on to the next bit will streamline the process. It will reduce the probability of security vulnerabilities and leads to robust applications.
Security as code
‘Security as Code’ is the concept of including security best practices into the existing DevOps pipeline. One of the most critical processes that this concept entails is the static analysis of code. Security practitioners can focus testing on code that has changed, in contrast to analyzing the entire code base.
Implementing a good change management process will allow members of all teams to submit changes and improvements. This type of process will enable security teams to remedy security issues directly without disrupting the development cycle.
Automation is another essential aspect of ‘security as code.’ Teams can automate security tasks to ensure that they conventionally verify all iterations. This uniformity will help to reduce or eliminate the presence of known security issues. Automation can significantly reduce the time spent on troubleshooting and fixing security issues later in the development cycle.
Put your application through security checks
Your application should be subject to regular testing. It should also undergo more rigorous testing such as preventing denial of service attacks.
There may be vulnerabilities in a solution that are only evident when that solution is broken. These are still genuine problems that the product owner may face.
Organizations are seeing an increasing number of malicious attacks. These attacks may focus on any aspect of a client’s organization that is accessible from outside of the network.
By testing your application under particularly strenuous circumstances, you can secure it through various scenarios.
How to Implement DevSecOps?
Each of the teams involved in DevSecOps needs to contribute towards its success.
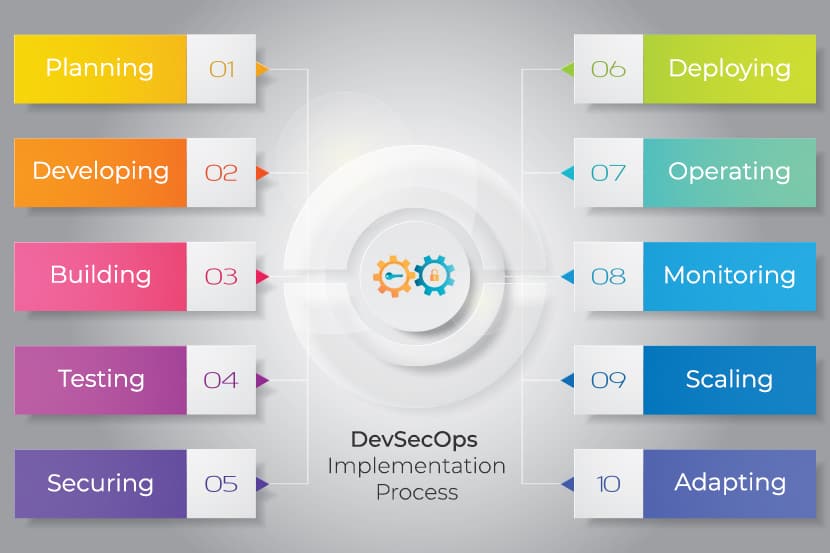
Development
Developers perform an essential role in the DevSecOps process. Developers must be open to the involvement of operations and security teams. The participation of these teams from an early stage of the design and development process will facilitate a secure DevOps transformation and make applications overall more secure.
Training developers in security best practices is essential to success. Companies can supplement this training with hiring developers who have experience in DevSecOps so that they can guide the rest of the team.
Companies must build a culture where developers are aware that developing security is a shared responsibility between them and security teams. Security practitioners can only recommend security practices. It is the responsibility of developers to implement them.
Operations
The contribution of the operations team is similar to that of the development team. Operations teams must collaborate with security practitioners. They are responsible for subjecting infrastructure and network configurations to security tests.
Security teams will also need to train operations teams regarding security practices to make DevSecOps successful. Operations and security teams, in collaboration, will then set up both manual and automated security tests to ensure compliance with network configurations.
Security
DevSecOps is as much of an adjustment for security teams as it is for development and operations teams. Security teams have to gradually increase their involvement while cooperating with development and operations teams.
Security practitioners should start with the concept of ‘shifting left.’ That is, collaborating with development and operations teams to move security reviews and automated tests towards the beginning of the software development lifecycle. This process of shifting left is essential to reduce the chances of unforeseen security issues popping up later.
Development and operations teams usually see security tests as a tedious and complicated task. So the duty of security teams does not stop at developing security tests but extends to involving and training the other teams.
DevSecOps is the Future
DevSecOps methodology has gained momentum due to the high cost of correction of security issues and security debt. As Agile teams release applications more frequently, security testing becomes more crucial. We hope some of the best practices mentioned in this article will help your company to transition from DevOps to a DevSecOps approach.
If you wish to learn more about how to adopt DevSecOps, contact our experts today.
Kubernetes Monitoring: Gain Full-Stack Visibility
Microservices — now the de-facto choice for how we build our infrastructure — naturally paved the way for containers. With container orchestration tools like Docker and Kubernetes, organizations can now ship applications more quickly, at greater scale. But, with all that power and automation come challenges, especially around maintaining visibility into this ephemeral infrastructure.
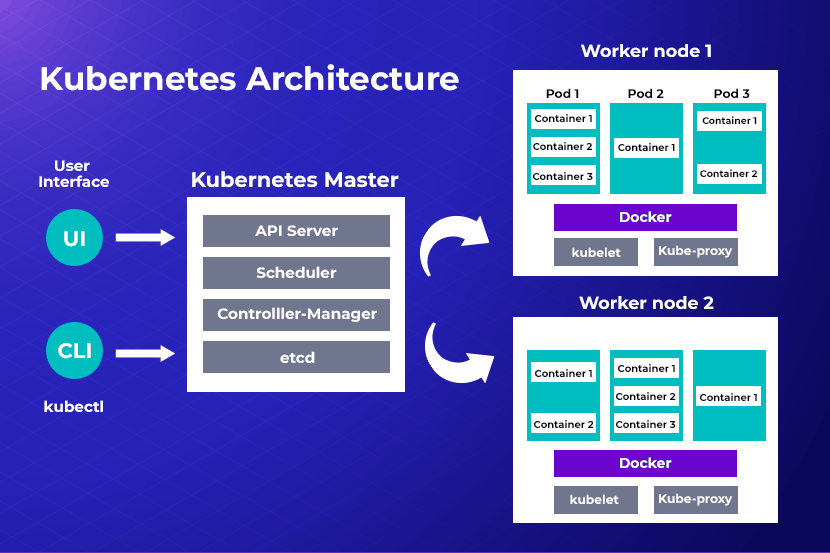
Monitoring Kubernetes Workloads
Kubernetes is complex, (to find out exactly what Kubernetes is and how it works, read our complete guide on Kubernetes). To use it successfully, it requires that several components be monitored simultaneously. To make your strategy for monitoring easier, separate monitoring operations into several areas, with each section referring to an individual layer of the Kubernetes environment. Then break down the monitoring of workload from top-down: clusters, pods, applications, and finally, the end-user experience.
Monitoring Kubernetes Clusters
The cluster is the highest-level constituent of Kubernetes. Most Kubernetes installations have just one cluster. This is why when you monitor the cluster, you get a full view across all areas. And can easily ascertain the health of pods, nodes, and apps that make up the cluster.
When deploying multiple clusters using federation, each cluster must be monitored individually. The areas you will monitor at the cluster level would be:
- Unsuccessful pods: Pods which fail and abort are a normal part of Kubernetes processes. When a pod that should be working at a more efficient level or is inactive, it’s critical to look into the reason behind the anomalies in pod failures.
- Node load: Tracking the load on each node is integral to monitoring efficiency. Some nodes may have a lot more usage than others. Rebalancing the load distribution is key to keeping workloads fluid and effectual. This can be done via DaemsonSets.
- Cluster usage: Monitoring cluster infrastructure allows you to adjust the number of nodes in use and dedicate resources to power workloads efficiently. You can see how resources are being distributed so you can scale up or down and avoid the costs of additional infrastructure. To that end, we recommend learning how to set a container’s memory and CPU usage limit.
Monitoring Kubernetes Pods
Cluster monitoring gives a macro view of the Kubernetes environment, but collecting data from individual pods is also essential. It reveals the health of individual pods and the workloads they are hosting. You get a clearer picture of pod performance at a granular level, beyond the cluster. Here you would monitor:
- Total pod instances: There need to be enough instances of a pod to ensure high availability. This way hosting bandwidth is not wasted, and you do not run more pod instances than needed.
- Pod deployment: Monitoring pods deployment allows you to see if any misconfigurations might be diminishing the availability of pods. It’s critical to keep an eye on how resources distribute to nodes.
- Actual pod instances: Monitoring the number of instances for each pod is running versus what you expected to be running will reveal how to can redistribute resources to achieve the desired state in terms of pods instances. ReplicaSets could be misconfigured if you see varying metrics, so it’s important to analyze these regularly.
Monitoring Applications Running in Kubernetes
Applications are not a part of Kubernetes, but wanting to host an application is the whole point of using Kubernetes. That’s why monitoring the application that’s hosted on the cluster is integral for success. Issues that application monitoring reveals could be a problem with the Kubernetes environment, or in the application’s code.
By monitorings apps, you can identify the glitches and resolve them without delay. Start by monitoring:
- Errors: If an error happens, you can get to it quickly when monitoring, and resolve it before it affects end-users.
- Transaction traces: Transaction traces assist you in troubleshooting if apps experience availability or performance problems.
- Application responsiveness: You can monitor how long it takes for an app to respond to a request. You can see if they can handle current workloads or if they are struggling to maintain performance.
- Application availability: Monitor if apps are active and up, and efficiently responding.
Monitoring End-user Experience when Running Kubernetes
End-user experience, like applications, technically is not a part of the Kubernetes platform. The overall goal for an application is to give end-users a positive experience and should be a part of your Kubernetes monitoring strategy.
Collecting data will let you know how the app is performing, its responsiveness, and its usability. Doing real-user and synthetic monitoring is essential to understand how users interact with Kubernetes workloads. It lets you know if you need to make any adaptations or adjustments which will enhance usability and improve the frontend.
Monitoring Kubernetes in a Cloud Environment
When Kubernetes is running in the cloud, there are specific factors to consider when planning your monitoring strategy. In the cloud, you will also have to monitor:
- IAM events: You will have to monitor for IAM activity. That includes permissions changes and logins, which is a best practice for security in a cloud-based installation or environment.
- Cloud APIs: A cloud provider has its own APIs, and your Kubernetes installation uses it to request resources, so it needs to be monitored.
- Costs: Costs on the cloud can quickly run-up. Cost monitoring assists you with budgeting and ensures that you do not overspend on cloud-based Kubernetes services.
- Network performance: In a cloud-based installation, the network can become the largest hindrance to the performance of your applications. If you monitor the cloud network regularly, you can be sure that data is moving as rapidly as needed so that you can avoid network-related problems.

Monitoring Metrics in Kubernetes
To gain higher visibility into a Kubernetes installation outside of performing different types of monitoring for Kubernetes, there are also several metrics that will give you valuable insight into how your apps are running.
Common Metrics
These are metrics collected from Kubernetes’ code (written in Golang). It allows you to understand what’s going on at a cellular level in the platform.
Node Metrics
Metrics from operating systems enabling Kubernetes’ nodes can give you insight into the overall health of individual nodes. You can monitor memory consumption, filesystem activity, CPU load, usage, and network activity.
Kubelet Metrics
To make sure the Control Plane is communicating efficiently with each individual node that a Kubelet runs on, you should monitor the Kubelet agent regularly.
Kube-State-Metrics
You can get an elective Kubernetes add-on which generates metrics from the Kubernetes API called Kube-State-Metrics.
Controller Manager Metrics
To ensure that workloads are orchestrated effectively you can monitor the requests that the Controller is making to external APIs. This is critical in cloud-based Kubernetes deployments.
Scheduler Metrics
If you want to identify and prevent delays, you should monitor latency in the Scheduler. This way you can ensure Kubernetes is deploying pods smoothly and on time.
Etcd Metrics
Etcd stores all the configuration data for Kubernetes. Etcd metrics will give you essential visibility into the condition of your cluster.
Container Metrics
Looking specifically into individual containers will allow you to monitor exact resource consumption rather than more general Kubernetes metrics. CAdvisor allows you to analyzes resource usage happening inside containers.
API Server Metrics
APIs keeps the Kubernetes frontend together and so these metrics are vital for gaining visibility into the API Server, and thereby into the whole frontend.
Log Data
Logs are useful to examine when you find a problem revealed by metrics. They give you exact and invaluable information which provides more details than metrics. There are many options for logging in most of Kubernetes’ components. Applications also generate log data.
Kubernetes Monitoring Challenges, Solutions and Tips
Migrating applications from monolithic infrastructures to microservices managed by Kubernetes is a long and intensive process. It can be full of pitfalls and can prove to be error-prone. But to achieve higher availability, innovation, cost benefits, scalability, and agility, it’s the only way to grow your business, especially in the cloud. Visibility is the main issue when it comes to Kubernetes environments as seeing real-time interactions of each microservice is challenging, due to the complexity of the platform. Monitoring is a specialized skill each enterprise will need to practice and improve upon to be successful.
A Kubernetes cluster can be considered complex due to its multiple servers and integrated private and public cloud services. When an issue arises, there are many logs, data, and other factors to examine. Legacy monolithic environments only need a few log searches to ascertain the problem. Kubernetes environments, on the other hand, have one or several logs for the multiple microservices implicated in the issue you’re experiencing.
To address these challenges, we’ve put together the following recommendations for effectively monitoring containerized infrastructure.
Effective Use of the Sidecar Pattern for Improved Application Monitoring in Kubernetes
One key best practice is leveraging role-based access within Kubernetes to provide end-to-end control by a single team with their monitoring solution, and without having full control of the cluster. Leveraging a monitoring solution under a team namespace helps operators easily control monitoring for their microservice-based container application inside the scope of their team.
However, they can add additional monitoring support without having to rebuild their application container. A dynamic approach to monitoring improves observability and drives context — without having to pull containers down if they start to exhibit issues.
Namespace Observability
By leveraging an open source monitoring event pipeline, such as Sensu Go, operations teams can get a dedicated team view of containers to improve visibility into their applications and increase insight into possible anomalies. These types of solutions offer dynamic monitoring changes for ephemeral infrastructure. As a result, operators can help drive collaboration securely by using Kubernetes’ built-in concept for role-based access control.
Kubernetes provides namespace scoping for resources, making it possible to give individual teams full control of applications under their namespace. Operators can also create containers and pods in a Kubernetes namespace and map it directly to code-driven monitoring tools, leveraging the same namespace as well.
For example, you can have an ‘Associated’ namespace in open source monitoring event pipeline – similar to Kubernetes — so that one team can control containers and monitoring around it using a repository of declarative YAML config files. With RBAC (role-based access control), you can mitigate risk by providing only necessary access to a user so they don’t have more than is needed.
Codifying monitoring workflows into declarative configuration files allows you to monitor at the speed of automation. It can be shared, treated as code, reviewed, edited, and versioned, allowing for efficient multi-cloud operation. Read more on how to monitor Kubernetes with Prometheus
Best Practices for Logs in Kubernetes
Application log aggregation for containerized workloads is an essential best practice that can improve software development. Because of the ephemeral nature of containerized workloads, the number of log entries being generated in a cluster can be quite large.
Logging agents like Fluentd and FluentBit — cross-platform, open-source data collection software projects originally developed at Treasure Data — are typically used as DaemonSets to collect the logs for all pods running on a node, using a privileged volume mount of the log files stored by the container runtime. These are cluster-level tools used to aggregate logs into a data lake such as Elasticsearch or send them into a stream processor solution like Kafka — and you might want to use functional role-based monitoring to track these additional pieces of log aggregation infrastructure running outside of your Kubernetes cluster.
Use a Kubernetes Monitoring Solution
Visibility is essential for enterprises to identify container issues that impede application performance. You can monitor containerized applications running inside Kubernetes pods more efficiently and scale up or down depending on the need. This is why it is critical to have a comprehensive Kubernetes monitoring solution that will give you end-to-end visibility into each and every component of your applications. From pods, nodes, containers, infrastructure, Kubernetes platform, to each microservice and end-user device.
Monitor Kubernetes with APM
Implementing an application performance monitoring solution (APM) gives enterprises visibility into their applications and allows them to asses overall performance. It organizes and offers insights into Kubernetes clusters, Docker containers, and containerized applications. You can examine the infrastructure’s fundamental metrics, learn about potential impediments, and make adjustments.
Get instant visibility into, memory, CPU and network utilization, and resource usage statistics when deploying APM-monitored container applications. APM metrics quickly identify common issues such as bandwidth- monopolizing applications or recognize far-reaching container-level network errors.
With these tips and monitoring strategies, operators can take huge leaps forward to gain greater visibility into their container-based infrastructure. And embrace multi-cloud operation with confidence. Want help getting started? Contact one of our experts today.
Article written in collaboration with Jef Spaleta, Principal Developer Advocate at Sensu.

Extend Your Development Workstation with Vagrant & Ansible
The mention of Vagrant in the title might have led you to believe that this is yet another article about the power of sharing application environments. As one does with code or how Vagrant is a great facilitator for that approach. However, there exists plenty of content about that topic, and by now the benefits of it are widely known. Instead, we will describe our experience in putting Vagrant to use in a somewhat unusual way.
A Novel Idea
The idea is to extend a developer workstation running Windows to support running a Linux kernel in a VM and to make the bridge between the two as seamless as possible. Our motivation was to eliminate certain pain points or restrictions in development. Which are brought about by the choice of OS for the developer’s local workstation. Be it a requirement at an organizational level, regulatory enforcement or any other thing that might or might not be under the developer’s control.
This approach is not the only one evaluated, as we also considered shifting work entirely to a guest OS on a VM, using Docker containers, leveraging Cygwin. And yes, the possibility of replacing the host OS was also challenged. However, we found that the way technologies came together in this approach can be quite powerful.
We’ll take this opportunity to communicate some of the lessons learned and limitations of the approach and share some ideas of how certain problems can be solved.

Why Vagrant?
The problem that we were trying to solve and the concept of how we tried to do it does not necessarily depend on Vagrant. In fact, the idea was based on having a virtual machine (VM) deployed on a local hypervisor. Running the VM locally might seem dubious at first thought. However, as we found out, this gives us certain advantages that allow us to create a better experience for the developer by creating an extension to the workstation.
We opted to go for VirtualBox as a virtualization provider primarily because of our familiarity with the tool and this is where Vagrant comes into play. Vagrant is one of the tools that make up the open-source HashiCorp Suite, which is aimed at solving the different challenges in automating infrastructure provisioning.
In particular, Vagrant is concerned with managing VM environments in the development phase Note, for production environments there are other tools in the same suite that are more suitable for the job. More specifically Terraform and Packer, which are based on configuration as code. This implies that an environment can be easily shared between team members and changes are version controlled and can be tracked easily. Making the resultant product (the environment) consistently repeatable. Vagrant is opinionated and therefore declaring an environment and its configuration becomes concise, which makes it easy to write and understand.
Why Ansible?
After settling on using Vagrant for our solution and enjoying the automated production of the VM; the next step was to find a way to provision that VM in a way that marries the principles advertised by Vagrant.
We do not recommend having Vagrant spinning up the VMs in an environment and then manually installing and configuring the dependencies for your system. In Vagrant, provisioners are core and there are plenty from which you can choose. In our case, as long as our provisioning remained simple we stuck with using Shell (Vagrant simply uploads scripts to the guest OS and executes them).
Soon after, it became obvious that that approach would not scale well, alongside the scripts being too verbose. The biggest pain point was that developers would need to write in a way that favored idempotency. This is due to the common occurrence of needing to add steps to the configuration. All the while being overkill to have to re-provision everything from scratch.
At this point, we decided to use Ansible. Ansible by RedHat is another open-source automation tool that is built around the idea of managing the execution of plays. Using a playbook where a play can be thought of as a list of tasks mapped against a group of hosts in an environment.
These plays should ideally be idempotent which is not always possible. And again the entire configuration one would write is declared as code in YAML. The biggest win that was achieved with this strategy is that the heavy lifting is done by the community. It provides Ansible Modules, configurable Python scripts that perform specific tasks, for virtually anything one might want to do. Installing dependencies and configuring the guest according to industry standards becomes very easy and concise. Without requiring the developer to go into the nitty-gritty details since modules are in general highly opinionated. All of these concepts combine perfectly with the principles for Vagrant and integration between the two works like a charm.
There was one major challenge to overcome in setting up the two to work together. Our host machine runs Windows, and although Ansible is adding more support for managing Windows targets with time, it simply does not run from a Windows control machine. This leaves us with two options: having a further environment which can act as the Ansible controller or the simpler approach of having the guest VM running Ansible to provision itself.
The drawback of this approach is that one would be polluting the target environment. We were willing to compromise on this as the alternative was cumbersome. Vagrant allows you to achieve this by simply replacing the provisioner identifier. Changing from ansible to ansible_local, it automatically installs the required Ansible binaries and dependencies on the guest for you to use.
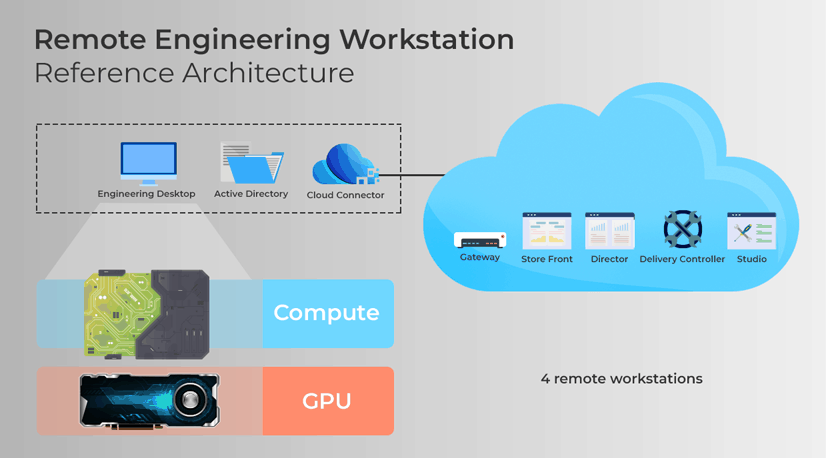
File Sharing
One of the cornerstones we wanted to achieve was the possibility to make the local workspace available from within the guest OS. This is so you can have the tooling which makes up a working environment be readily available to easily run builds inside the guest. The options for solving this problem are plenty and they vary depending on the use case. The simplest approach is to rely on VirtualBox`s file-sharing functionality which gives near-instant, two-way syncing. And setting it up is a one-liner in the VagrantFile.
The main objective here was to share code repositories with the guest. It can also come handy to replicate configuration for some of the other toolings. For instance, one might find it useful to configure file sharing for Maven`s user settings file, the entire local repository, local certificates for authentication, etc.
Port Forwarding
VirtualBox`s networking options were a powerful ally for us. There are a number of options for creating private networks (when you have more than one VM) or exposing the VM on the same network as the host. It was sufficient for us to rely on a host-only network (i.e. the VM is reachable only from the host). And then have a number of ports configured for forwarding through simple NAT.
The major benefit of this is that you do not need to keep changing configuration for software, whether it is executing locally or inside the guest. All of this can be achieved in Vagrant by writing one line of configuration code. This NATting can be configured in either direction (host to guest or guest to host).
Bringing it together
Having defined the foundation for our solution, let’s now briefly go through what we needed to implement all of this. You will see that for the most part, it requires minimal configuration to reach our target.
The first part of the puzzle is the Vagrantfile in which we define the base image for the guest OS (we went with CentOS 7). The resources we want to allocate (memory, vcpus, storage), file shares, networking details and provisioning.
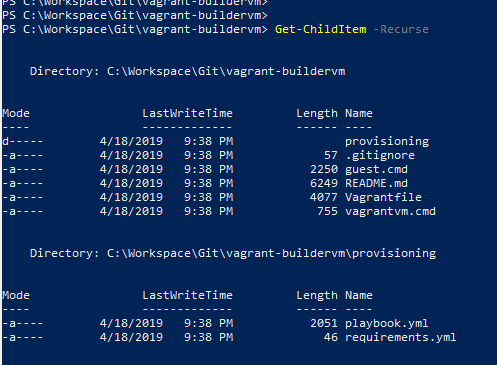
Note that the vagrant plugin `vagrant-vbguest` was useful to automatically determine the appropriate version of VirtualBox’s Guest Addition binaries for the specified guest OS and installing them. We also opted to configure Vagrant to prefer using the binaries that are bundled within itself for functionality such as SSH (VAGRANT_PREFER_SYSTEM_BIN set to 0) rather than rely on the software already installed on the host. We found that this allowed for a simpler and more repeatable setup process.
The second major part of the work was integrating Ansible to provision the VM. For this we opted to leverage Vagrant’s ansible_local that works by installing Ansible in the guest on the fly and running provisioning locally.
Now, all that is required is to provide an Ansible playbook.yml file and here one would define any particular configuration or software that needs to be set up on the guest OS.

We went a step further and leveraged third-party Ansible roles instead of reinventing the wheel and having to deal with the development and ongoing maintenance costs.
The Ansible Galaxy is an online repository of such roles that are made available by the community. And you install these by means of the ansible-galaxy command.
Since Vagrant is abstracting away the installation and invocation of Ansible, we need to rely on Vagrant. Why? To make sure that these roles are installed and made available when executing the playbook. This is achieved through the galaxy_command parameter. The most elegant way to achieve this is to provide a requirements.yml file with the list of roles needed and have it passed to the ansible-galaxy command. Finally, we need to make sure that the Ansible files are made available to the guest OS through a file share (by default the directory of the VagrantFile is shared) and that the paths to them are relative to /vagrant.
Building a seamless experience…BAT to the rescue
We were pursuing a solution that makes it as easy as possible to jump from working locally to working inside the VM. If possible, we also wanted to be able to make this switch without having to move through different windows.
For this reason, we wrote a couple of utility batch scripts that made the process much easier. We wanted to leverage the fact that our entire workspace directory was synced with the guest VM. This allowed us to infer the path in the workspace on the guest from the current location in the host. For example, if on our host we are at C:WorkspaceProjectX and the workspace is mapped to vagrantworkspace, then we wanted the ability to easily run a command in vagrantworkspaceprojectx without having to jump through hoops.
To do this we placed a script on our path that would take a command and execute it in the appropriate directory using Vagrant’s command flag. The great thing about this trick is that it allowed us to trigger builds on the guest with Maven through the IDE by specifying a custom build command.
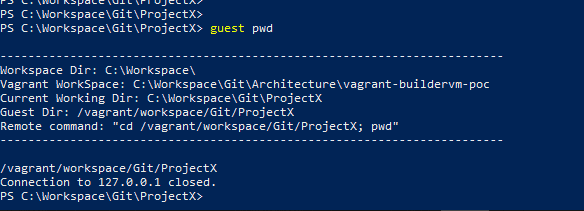
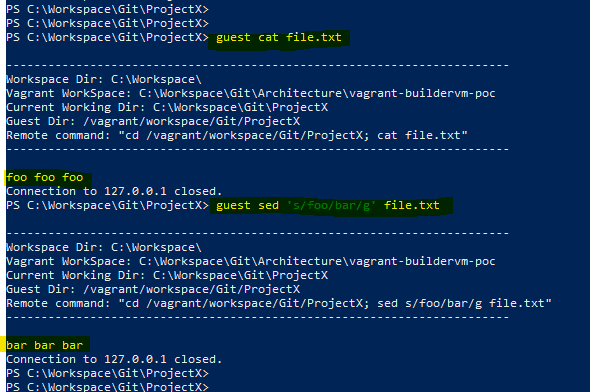
We also added the ability to the same script to SSH into the VM directly in the path corresponding to the current location on the host. To do this, on VM provisioning we set up a file share that allows us to sync the bashrc directory in the vagrant user’s home folder. This allows us to cd in the desired path (which is derived on the fly) on the guest upon login.
Finally, since a good developer is an efficient developer, we also wanted the ability to manage the VM from anywhere. So if, for instance, we have not yet launched the VM we would not need to keep navigating to the directory hosting the VagrantFile.
This is standard Vagrant functionality that is made possible by setting the %VAGRANT_CWD% variable. What we added on top is the ability to define it permanently in a dedicated user variable. And simply set it up only when we wanted to manage this particular environment.
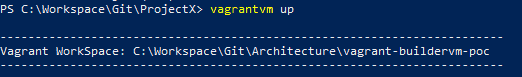
File I/O performance
In the course of testing out the solution, we encountered a few limitations that we think are relevant to mention.
The problems revolved around the file-sharing mechanism. Although there are a number of options available, the approach might not be a fit for certain situations that require intensive File I/O. We first tried to set up a plain VirtualBox file share and this was a good starting point since it works. And without requiring many configurations, it syncs 2-ways instantaneously, which is great in most cases.
The first wall was hit as soon as we tried running a FrontEnd build using NPM which relies on creating soft-links for common dependency packages. Soft-linking requires a specific privilege to be granted on the Windows host and still, it does not work very well. We tried going around the issue by using RSync which by default only syncs changes in one direction and runs on demand. Again, there are ways to make it poll for changes and bi-directionality could theoretically be set up by configuring each direction separately.
However, this creates a race-condition with the risk of having changes reversed or data loss. Another option, SMB shares, required a bit more work to set up and ultimately was not performant enough for our needs.
In the end, we found a solution to make the NPM build run without using soft-links and this allowed us to revert to using the native VirtualBox file share. The first caveat was that this required changes in our source-code repository, which is not ideal. Also, due to the huge number of dependencies involved in one of our typical NPM-based FrontEnd builds, the intense use of File I/O was causing locks on the file share, slowing down performance.
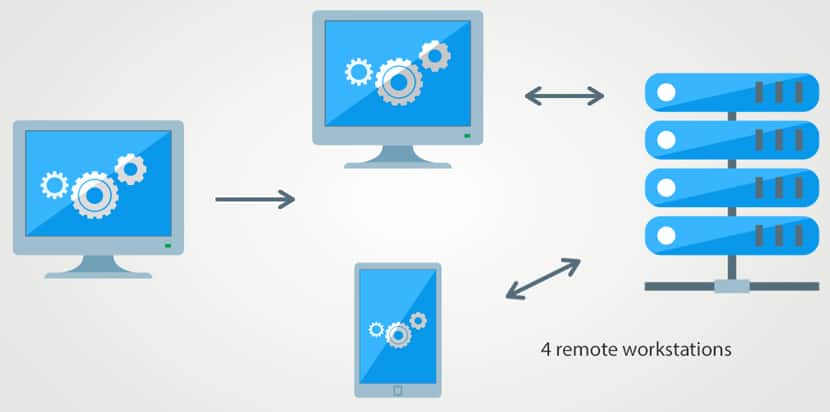
Conclusions
The aim was to extend a workstation running Windows by also running a Linux Kernel, to make it as easy as possible to manage and switch between working in either environment. The end result from our efforts turned out to be a very convenient solution in certain situations.
Our setup was particularly helpful when you need to run applications in an environment that is similar to production. Or when you want to run certain tooling for development, which is easier to install and configure on a Linux host. We have shown you how, with the help of tools like Vagrant and Ansible, it is easy to create a setup in such a way that can be shared and recreated consistently. Whilst keeping the configuration concise.
From a performance point of view, the solution worked very well for tasks that were demanding from a computation perspective. However, not the same can be said for situations that required intensive File I/O due to the overhead in synchronization.
For more knowledge-based information, check out what our experts have to say. Bookmark the site to stay updated weekly.

Ansible vs Terraform vs Puppet: Which to Choose?
In the ‘DevOps’ world, organizations are implementing or building processes using Infrastructure as Code (IAC). Ansible, Terraform, and Puppet allow enterprises to scale and create repeatable configurations that test and enforce procedures to continually ensure the right results.
We will examine the differences between these three more in-depth. To guide you through choosing a platform that will work best for your needs. All three are advanced-level platforms for deploying replicable and repetitive applications that have highly complex requirements.
Compare the similarities and differences these applications have in terms of configuration management, architecture, and orchestration and make an informed decision.
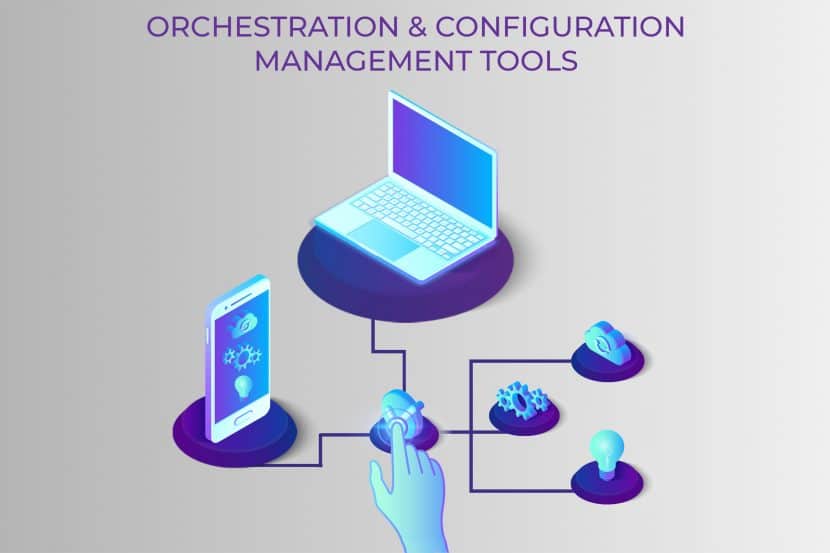
Infrastructure as Code
Introduced over a decade ago, the concept of Infrastructure as Code (IAC) refers to the process of managing and provisioning computer data centers. It’s a strategy for managing data center servers, networking infrastructure, and storage. Its purpose is to simplify large-scale management and configuration dramatically.
IAC allows provisioning and managing of computer data centers via machine-readable definition files without having to configure tools or physical hardware. In simpler terms, IAC treats manual configurations, build guides, run books, and related procedures as code. Read by software, the code that maintains the state of the infrastructure.
Designed to solve configuration drift, system inconsistencies, human error, and loss of context, IAC resolves all these potentially crippling problems. These processes used to take a considerable amount of time; modern IAC tools make all processes faster. It eliminates manual configuration steps and makes them repeatable and scalable. It can load several hundred servers significantly quicker. It allows users to gain predictable architecture and confidently maintain the configuration or state of the data center.
There are several IAC tools to choose from, with three major examples being Ansible, Terraform, and Puppet. All of them have their unique set of strengths and weaknesses, which we’ll explore further.
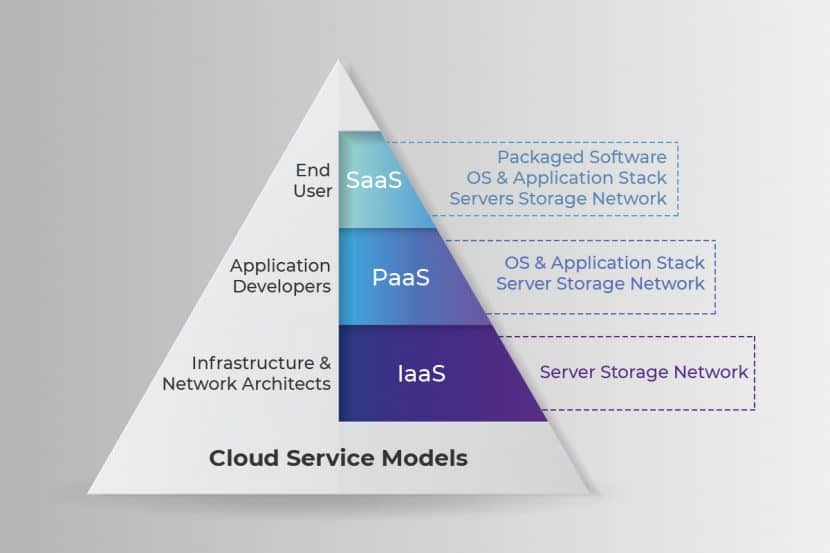
Short Background on Terraform, Ansible, and Puppet
Before we begin comparing the tools, see a brief description below:
- Terraform (released 2014 – current version 0.12.8): Hashicorp developed Terraform as an infrastructure orchestrator and service provisioner. It is cloud-agnostic, supporting several providers. As a result, users can manage multi-cloud or multi offering environments, using the same programming language and configuration construct. It utilizes the Haschorp Language and is quite user-friendly as compared to other tools.
- Ansible (released 2012 – current version 2.8.4): Ansible is a powerful tool used to bring services and servers into the desired state, utilizing an assortment of classes and configuration methods. Additionally, it can also connect to different providers via wrapper modules to configure resources. Users prefer it because it is lightweight when coding is concerned, with speedy deployment capabilities.
- Puppet (released 2005 – current version 6.8.0): Puppet is one of the oldest declarative desired state tools available. It is server/client-based, one which refreshes the state on clients via a catalog. It uses “hieradata”, a robust metadata configuration method. It enforces system configuration with programs through its power to define infrastructure as code. It’s widely used on Windows or Linux to pull strings on multiple application servers simultaneously.
Orchestration vs Configuration Management
Ansible and Terraform have some critical differences, but the two do have some similarities as well. They differ when we look at two DevOps concepts: orchestration and configuration management, which are types of tools. Terraform is an orchestration tool. Ansible is mainly a configuration management tool (CM); they perform differently but do have some overlaps since these functions are not mutually exclusive. Optimized for various usage and strengths, use these tools for situations.
Orchestration tools have one goal: to ensure an environment is continuously in its ‘desired state.’ Terraform is built for this as it stores the state of the environment, and when something does not function properly, it automatically computes and restores the system after reloading. It’s perfect for environments that need a constant and invariable state. ‘Terraform Apply’ is made to resolve all anomalies efficiently.
Configuration management tools are different; they don’t reset a system. Instead, they locally repair an issue. Puppet has a design that installs and manages software on servers. Like Puppet, Ansible also can configure each action and instrument and ensure its functioning correctly without any error or damage. A CM tool works to repair a problem instead of replacing the system entirely. In this case, Ansible is a bit of a hybrid since it can do both, perform orchestration and replace infrastructure. Terraform is more widely used. It’s considered the superior product since it has advanced state management capabilities, which Ansible does not.
The important thing to know here is that there is an overlap of features here. Most CM tools can do provisioning to some level, and vice versa, many provisioning tools can do a bit of configuration management. The reality is that different tools are a better fit for certain types of tasks, so it comes down to the requirements of your servers.
Procedural vs. Declarative
DevOps tools come in two categories that define their actions: ‘declarative’ and ‘procedural.’ Not every tool will fit this mold as an overlap exists. Procedural defines a tool that needs precise direction and procedure that you must lay out in code. Declarative refers to a tool ‘declaring’ exactly what is needed. It does not outline the process needed to gain the result.
In this case, Terraform is wholly declarative. There is a defined environment. If there is any alteration to that environment, it’s rectified on the next ‘Terraform Apply.’ In short, the tool attempts to reach the desired end state, which a sysadmin has described. Puppet also aims to be declarative in this way.
With Terraform, you simply need to describe the desired state, and Terraform will figure out how to get from one state to the next automatically.
Ansible, alternatively, is somewhat of a hybrid in this case. It can do a bit of both. It performs ad-hoc commands which implement procedural-style configurations and uses most of the modules that perform in a declarative-style.
If you decide to use Ansible, read the documentation carefully, so you know its role and understand the behavior to expect. It’s imperative to know if you need to add or subtract resources to obtain the right result or if you need to indicate the resources required explicitly.
Comparing Provisioning
Automating the provisioning of any infrastructure is the first step in the automation of an entire operational lifecycle of an application and its deployment. In the cloud, the software runs from a VM, Docker container, or a bare metal server. Either Terraform, or Ansible is a good choice for provisioning such systems. Puppet is the older tool, so we’ll take a closer look at the newer DevOps programs for managing multiple servers.
Terraform and Ansible approach the process of provisioning differently, as described below, but there is some overlap.
Provisioning with Terraform:
There are certain behaviors not represented in Terraform’s existing declarative model. This setup adds a significant amount of uncertainty and complexity when using Terraform in the following ways:
The Terraform model is unable to model the actions of provisioners when it is part of a plan. It requires coordinating more details than what is necessary for normal Terraform usage to use provisioners successfully.
It requires additional measures such as granting direct network access to the user’s servers, installing essential external software, and issuing Terraform credentials for logging in.
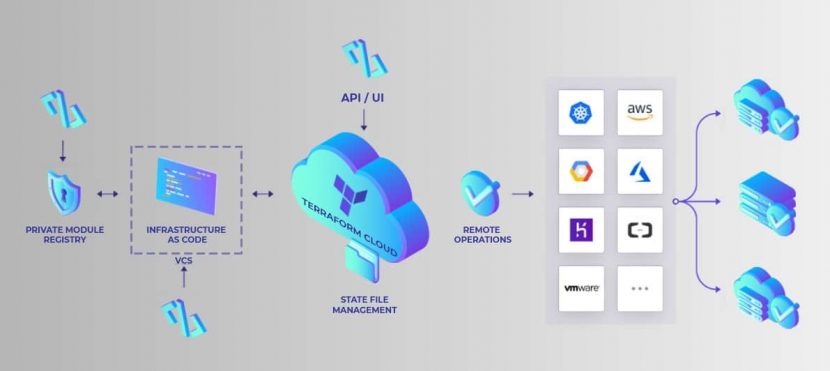
Provisioning with Ansible:
Ansible can provision the latest cloud platforms, network devices, bare metal servers, virtualized hosts, and hypervisors reliably.
After completing bootstrapping, Ansible allows separate teams to connect nodes to the storage. It can add them to a load balancer, or any security patched or other operational tasks. This setup makes Ansible the perfect connecting tool for any process pipeline.
It aids in automatically taking bare infrastructure right through to daily management. Provisioning with Ansible, allows users to use a universal, human-readable automation language seamlessly across configuration management, application deployment, and orchestration.
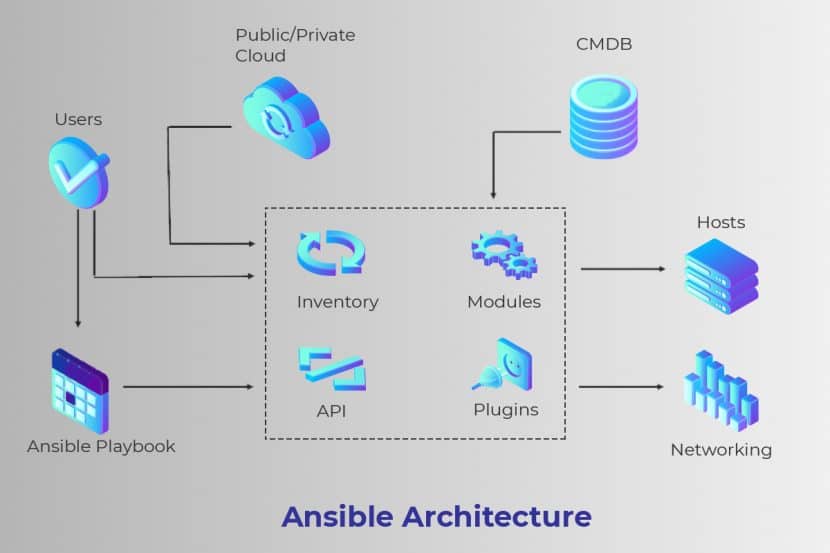
Differences between Ansible and Terraform for AWS
AWS stands for Amazon Web Services, a subsidiary of Amazon, which provides individuals, companies, and business entities on-demand cloud computing platforms. Both Terraform and Ansible treat AWS management quite differently.
Terraform with AWS:
Terraform is an excellent way for users who do not have a lot of virtualization experience to manage AWS. Even though it can feel quite complicated at first, Terraform has drastically reduced the hurdles standing in the way of increasing adoption.
There are several notable advantages when using Terraform with AWS.
- Terraform is open-source, bringing with it all the usual advantages of using open-source software, along with a growing and eager community of users behind it.
- It has an in-built understanding of resource relationships.
- In the event of a failure, they isolate to dependent resources. Non-dependent resources, on the other hand, continue to be created, updated, and destroyed.
- Terraform gives users the ability to preview changes before being applied.
- Terraform comes with JSON support and a user-friendly custom syntax.
Ansible with AWS:
Ansible has offered significant support for AWS for a long time. This support allows interpretation of even the most complicated of AWS environments using Ansible playbooks. Once described, users can deploy them multiple times as required, with the ability to scale out to hundreds and even thousands of instances across various regions.
Ansible has close to 100 modules that support AWS capabilities. Such as Virtual Private Cloud (VPC), Simple Storage Service (S3), Security Token Service, Security Groups, Route53, Relational Database Service, Lambda, Identity Access Manager (IAM), AMI Management and CloudTrail to name a few. Also, it includes over 1300 additional modules for managing different aspects of a user’s Linux, Windows, UNIX, etc.
Here are the advantages when using Ansible with AWS.
- With Ansible Tower’s cloud inventory synchronization, you will find out precisely which AWS instances register despite no matter how they launched.
- You can control inventory by keeping track of deployed infrastructure accurately via their lifecycles. So, you can be sure systems manage properly, and security policies execute correctly.
- Safety in automation with its set of role-based access controls ensuring users will only have access to the AWS resources they need to fulfill their job.
- The same simple playbook language manages infrastructure and deploys applications on a large scale and to different infrastructures easily.
Comparison of Ansible, Puppet, and Terraform
Puppet, Terraform, and Ansible have been around for a considerable period. However, they differ when it comes to set up, GUI, CLI, language, usage, and other features.
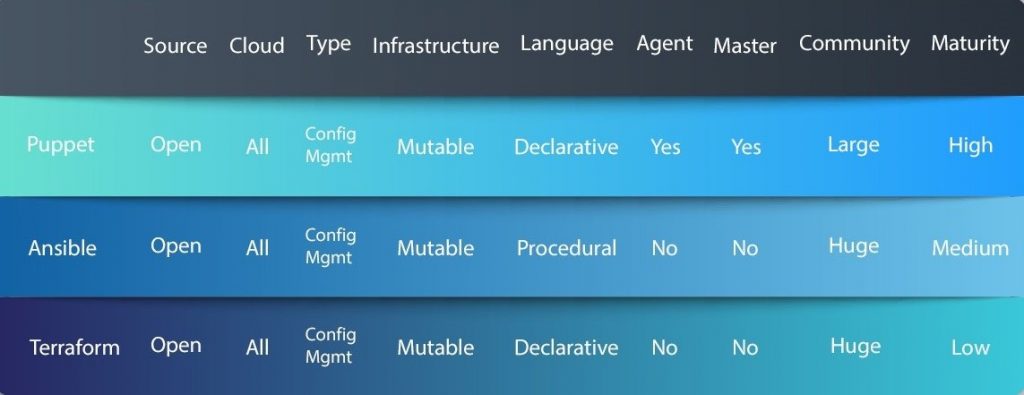
You can find a detailed comparison between the three below:
| Point of Difference | Ansible | Puppet | Terraform |
| Management and Scheduling | In Ansible, instantaneous deployments are possible because the server pushes configurations to the nodes. When it comes to scheduling, Ansible Tower, the enterprise version, has the capabilities while it is absent in the free version. | Puppet focuses mainly on the push and pulls configuration, where the clients pull configurations from the server. Configurations must be written in Puppet’s language. When it comes to scheduling, Puppet’s default settings allow it to check all nodes to see if they are in the desired state.
|
In Terraform, resource schedulers work similarly as providers enabling it to request resources from them. Thus, it is just not limited to physical providers such as AWS, allowing its use in layers. Terraform can be used to provision onto the scheduled grid, as well as setting up the physical infrastructure running the schedulers. |
| Ease of Setup and Use | Ansible is simpler to install and use. It has a master without agents, running on the client machines. The fact that it is agentless contributes significantly to its simplicity. Ansible uses YAML syntax, written in the Python language, that comes built-in most Linux and Unix deployments. | Puppet is more model-driven, meant for system administrators. Puppet servers can be installed on one or more servers, while the puppet agent requires installation on all the nodes that require management. The model is thus a client-server or agent-master model. Installation times can take somewhere around ten to thirty minutes. | Terraform is also simpler to understand when it comes to its setup as well as usage. It even allows users to use a proxy server if required to run the installer. |
| Availability: | Ansible has a secondary node in case an active node falls. | Puppet has one or more masters in case the original master fails. | Not Applicable in Terraform’s case. |
| Scalability: | Scalability is easier to achieve | Scalability is less easy to achieve | Scalability is comparatively easily achieved |
| Modules | Ansible’s repository or library is called Ansible Galaxy. It does not have separate sorting capabilities and requires manual intervention. | Puppet’s repository or library is called Puppet Forge. It contains close to 6000 modules. Users can mark puppet modules as approved or supported by Puppet, saving considerable time. | In Terraform’s case, modules allow users to abstract away any reusable parts. These parts can be configured once and can be used everywhere. It thus enables users to group resources, as well as defining input and output variables. |
| GUI | Less developed is Ansible’s GUI, first introduced as a command-line only tool. Even though the enterprise version offers a UI, it still falls short of expectations suffering from syncing issues with the command-line. | Puppet’s GUI is superior to that of Ansible, capable of performing many complex tasks. Used for efficiently managing, viewing, and monitoring activities. | Only third party GUIs are available for Terraform. For example, Codeherent’s Terraform GUI. |
| Support | Ansible also includes two levels of professional support for its enterprise version. Additionally, AnsibleFest, which is a big gathering of users and contributors, is held annually. The community behind it is smaller when compared to Puppet. | Puppet has a dedicated support portal, along with a knowledge base. Additionally, two levels of professional support exist; Standard and Premium. A “state of DevOps” report is produced annually by the Puppet community. | Terraform provides direct access to HashiCorp’s support channel through a web portal. |
Three Comprehensive Solutions To Consider
After looking at the above comparisons, Ansible is quite beneficial for storage and configuring systems in script-like fashion, versus the others. Users can efficiently work in short-lived environments. It also works seamlessly with Kubernetes for configuring container hosts.
Puppet is more mature when it comes to its community support. Puppet has superior modules that allow it to work more as an enterprise-ready solution. Its robust module testing is easy to use. Ansible is suitable for small, temporary, and fast deployments. Whereas, Puppet comes recommended for longer-term or more complex deployments and can manage Docker containers and container orchestrators.
Terraform performs better when it comes to managing cloud services below the server. Ansible is excellent at provisioning software and machines; Terraform is excellent at managing cloud resources.
All three have their benefits and limitations when designing IAC environments for automation. Success depends on knowing which tools to use for which jobs.
Find out which platform can best help redefine the delivery of your services. Reach out to one of our experts for a consultation today.

Best Container Orchestration Tools for 2020
Orchestration tools help users manage containerized applications during development, testing, and deployment. They orchestrate the complete application life cycle based on given specifications. Currently, there is a large variety of Container Orchestration Tools. Do not be surprised if many are Kubernetes related, as many different organizations use it for their production environments. Let’s compare some of the top tools available in 2020.
Introduction to Container Orchestration
Container orchestration is the process of automating the management of container-based microservice applications across multiple clusters. This concept is becoming increasingly popular within organizations. Alongside it, a wide array of Container Orchestration tools have become essential in deploying microservice-based applications.
Modern software development is no longer monolithic. Instead, it creates component-based applications that reside inside multiple containers. These scalable and adjustable containers come together and coordinate to perform a specific function or microservice. They can span across many clusters depending on the complexity of the application and other needs such as load balancing.
Containers package together application code and their dependencies. They obtain the necessary resources from physical or virtual hosts to work efficiently. When complex systems are developed as containers, proper organization and prioritization are required when clustering them for deployment.

That is where Container orchestration tools come in to play along with numerous advantages, such as:
- Better environmental adaptability and portability.
- Effortless deploying and managing.
- Higher scalability.
- Stabler virtualization of OS resources.
- Constant availability and redundancy.
- Handles and spread application load evenly across the system.
- Improved networking within the application.
Comparing the Top Orchestration Tools
Kubernetes (K8s)
Google initially developed Kubernetes. It has since become a flagship project of the Cloud Native Computing Foundation. It is an open-source, portable, cluster managed orchestration framework. Most importantly, Kubernetes is backed by google. The design of Kubernetes allows containerized applications to run multiple clusters for more reliable accessibility and organization.
Kubernetes is extremely popular within DevOps circles because tools like Docker offer Kubernetes as Platform as a Service (PaaS) or infrastructure as a Service (IaaS).
Key Features
- Automated deployment, rollouts, and rollbacks.
- Automatic scalability and controllability
- Isolation of containers.
- Ability to keep track of service health
- Service discovery and load balancing
- It works as a platform providing service.
Advantages
- Provide complete enterprise-level container and cluster management services.
- It’s well documented and extensible.
- Adjust the workload without redesigning the application.
- Lesser resource costs.
- Flexibility in deploying and managing.
- Enhanced portability due to container isolation.
Many cloud providers use Kubernetes to give managed solutions as it’s the current standard for container orchestration tools.
Kubernetes Engine
Kubernetes Engine is part of the Google cloud platform with container and cluster management services. It provides all the functionality of Kubernetes, like deployment, scaling, and management of containerized applications. Also, it’s faster and more efficient as it’s not necessary to handle individual Kubernetes clusters.
Kubernetes engine manages and runs even Google’s applications like Gmail and YouTube. Synonymous with productivity, innovation, resource efficiency.
Key Features
- Support for Kubernetes based container tools like Docker.
- It offers a hybrid networking system where it allocates a range of IP addresses for a cluster.
- It provides powerful scheduling features.
- Utilizes its OS to manage and control the containers.
- Uses Google Cloud Platform’s control panel to provide integrated logging and monitoring.
Advantages
- Automatic scaling, upgrading, and repairing.
- Facilitate container isolation by removing interdependencies.
- Seamlessly load-balanced and scaled.
- Secure with Google’s Network policies.
- Portability between Clouds and On-Premises.
Amazon Elastic Kubernetes Service (EKS)
Amazon EKS is another well managed Kubernetes service. It takes over the responsibility of managing, securing, and scaling containerized applications. Thus, nullifying the need for the Kubernetes control panel. These EKS clusters run in AWS Fargate in multiple zones, which computes containers without a server. Kubernetes based applications can be conveniently migrated to Amazon EKS without any code refactoring.
EKS integrates with many open-source Kubernetes tools. These come from both the community and several AWS tools like Route 53, AWS Application Load Balancer, and Auto Scaling.
Key Features
- Facilitates a scalable and highly available control plane.
- Support for distributed infrastructure management in multiple AWS availability zones.
- Consumer service mesh features with AWS App Mesh.
- EKS integrates with many services like Amazon Virtual Private Cloud (VPC), Amazon CloudWatch, Auto Scaling Groups, and AWS Identity and Access Management (IAM).
Advantages
- Eliminates the necessity of provision and manage servers.
- Can specify the resources per application and pay accordingly.
- More secure with application isolation design.
- Continues healthy monitoring without any downtime upgrades and patching.
- Avoid single point of failure as it runs in multiple availability zones.
- Monitoring, traffic control, and load balancing are improved.
Azure Kubernetes Service (AKS)
AKS provides a managed service for hosted Kubernetes with continuous integration and continuous delivery approach. It facilitates convenient deploying and managing, serverless Kubernetes with more dependable security and governance.
AKS provides an agile microservices architecture. It enables simplified deployment and management of systems complex enough for machine learning. They can be easily migrated to the cloud with portability for its containers and configurations.
Key Features
- Integrated with Visual Studio Code Kubernetes tools, Azure DevOps and Azure Monitor
- KEDA for auto-scaling and triggers.
- Access management via Azure Active Directory.
- Enforce rules across multiple clusters with Azure Policy.
Advantages
- The ability to build, manage, and scale microservice-based applications.
- Simple portability and application migration options
- Better security and speed when Devops works together with AKS.
- AKS is easily scalable by using additional pods in ACI.
- Real-time processing of data streams.
- Ability to train machine learning models efficiently in AKS clusters using tools like Kubeflow.
- It provides scalable resources to run IoT solutions.
IBM Cloud Kubernetes Service
This option is a fully managed service designed for the cloud. It facilitates modern containerized applications and microservices. Also, it has capabilities to build and operate the existing applications by incorporating DevOps. Furthermore, It integrates with advance services like IBM Watson and Blockchain for swift and efficient application delivery.
Key Features
- Ability to containerize existing apps in the cloud and extend them for new features.
- Automatic rollouts and rollbacks.
- Facilitates horizontal scaling by adding more nodes to the pool.
- Containers with customized configuration management.
- Effective logging and monitoring.
- It has improved security and isolation policies.
Advantages
- Secure and simplified cluster management.
- Service discovery and load balancing capabilities are stabler.
- Elastic scaling and immutable deployment
- Dynamic provisioning
- Resilient and self-healing containers.
Amazon Elastic Container Service (ECS)
Amazon ECS is a container orchestration tool that runs applications in a managed cluster of Amazon EC2 instances. ECS powers many Amazon services such as Amazon.com’s recommendation engine, AWSBatch, and Amazon SageMaker. This setup ensures the credibility of its security, reliability, and availability. Therefore ECS can be considered as suitable to run mission-critical applications.
Key Features
- Similar to EKS, ECS clusters run in serverless AWS Fargate.
- Run and manage Docker containers.
- Integrates with AWS App Mesh and other AWS services to bring out greater capabilities. For example:
- Amazon Route 53,
- Amazon CloudWatch
- Access Management (IAM)
- AWS Identity,
- Secrets Manager
- Support for third party docker image repository.
- Support Docker networking through Amazon VPC.
Advantages
- Payment is based on resources per application.
- Provision and managed servers are not needed.
- Updated resource locations ensure higher availability.
- End to end visibility through service mesh
- Networking via Amazon VPC ensures container isolation and security.
- Scalability without complexity.
- More effective load balancing.
Azure Service Fabric
ASF is a distributed service framework for managing container-based applications or microservices. It can be either cloud-based or on-premise. Its scalable, flexible, data-aware platform delivers low latency and high throughput workloads, addressing many challenges of native cloud-based applications.
A “run anything anywhere” platform, it helps to build and manage Mission-critical applications. ASF supports Multi-tenant SaaS applications. IoT data gathering and processing workloads are its other benefits.
Key Features
- Publish Microservices in different machines and platforms.
- Enabling automatic upgrades.
- Self-repair scaling in or scaling out nodes.
- Scale automatically by removing or populating nodes.
- Facilitates the ability to have multiple instances of the same service.
- Support for multi-language and frameworks.
Advantages
- Low latency and improved efficiency.
- Automatic upgrades with zero downtime
- Supports stateful and stateless services
- It can be installed to run on multiple platforms.
- Allows more dependable resource balancing and monitoring
- Full application lifecycle management with CI/CD abilities.
- Perform leader election and service discovery automatically.
Docker Platform
Docker Orchestration tools facilitate the SDLC from development to production while Docker swarm takes care of cluster management. It provides fast, scalable, and seamless production possibilities for dispersed applications. A proven way to best handle Kubernetes and containers.
It enables building and sharing Docker images within teams as well as large communities. Docker platform is extremely popular among developers. According to a Stack Overflow survey, it ranked as the most “wanted,” “loved,” and “used” platform.
Key Features
- It supports both Windows and Linux OS
- It provides the ability to create Windows applications using the Docker Engine (CS Docker Engine) and Docker Datacenter.
- It uses the same kernel as Linux, which is used in the host computer.
- Supports any container supported infrastructure.
- Docker Datacenter facilitates heterogeneous applications for Windows and Linux.
- Docker tools can containerize legacy applications through Windows server containers.
Advantages
- It provides a perfect platform to build, ship, and run distributed systems faster.
- Docker provides a well-equipped DevOps environment for developers, testers, and the deployment team.
- Improved performance with cloud-like flexibility.
- Smaller size as it uses the same kernel as the host.
- It provides the ability to migrate applications to the cloud without a hassle.
Helios
Helios is an open-source platform for Docker by Spotify. It enables running containers across many servers. Further, it avoids a single point of failure since it can handle many HTTP requests at the same time. Helios logs all deploys, restarts, and version changes. It can be managed through its command-line and via HTTP API.
Key Features
- Fits easily into the way you do DevOps.
- Works with any network topology or operating system.
- It can run many machines at a time or a single machine instance.
- No prescribed service discovery.
- Apache Mesos is not a requirement to run Helios. However, JVM and Zookeeper are prerequisites.
Advantages
- Pragmatic
- Works at scale
- No system dependencies
- Avoid single points of failure

How to Choose a Container Orchestration Tool?
We have looked at several Orchestration Tools that you can consider choosing from when deciding what is best for your organization. To do so, be clear about your organization’s requirements and processes. Then you can more easily assess the pros and cons of each.
Kubernetes
Kubernetes provides a tremendous amount of functionality and is best suited for enterprise-level containers and cluster management. Various platforms manage Kubernetes like Google, AWS, Azure, Pivotal, and Docker. You have considerable flexibility as the containerized workload scales.
The main drawback is the lack of compatibility with Docker Swarm and Compose CLI manifests. It can also be quite complex to learn and set up. Despite these drawbacks, it’s one of the most sought after platforms to deploy and manage clusters.
Docker Swarm
Docker Swarm is more suitable for those already familiar with Docker Compose. Simple and straightforward it requires no additional software. However, unlike Kubernetes and Amazon ECS, Docker Swarm does not have advanced functionalities like built-in logging and monitoring. Therefore, it is more suitable for small scale organizations that are getting started with containers.
Amazon ECS
If you’re already familiar with AWS, Amazon ECS is an excellent solution for cluster deployment and configuration. A fast and convenient way to start-up and meets demand with scale, it integrates with several other AWS services. Furthermore, it’s ideal for small teams who do not have many resources to maintain containers.
One of its cons is that it’s not suitable for nonstandard deployments. It also has ECS specific configuration files making troubleshooting difficult.
Find Out More About Server Orchestration Tools
The software industry is rapidly moving towards the development of containerized applications. The importance of choosing the right tools to manage them is ever-increasing increasing.
Container Orchestration Platforms have various features and solutions for the challenges caused by their use. We have compared and analyzed the many differences between Container Orchestration Tools. The “Kubernetes vs. Docker-swarm” and “Kubernetes vs. Mesos” articles are noteworthy among them.
If you want more information about which tools suit your architecture best, book a call with one of our experts today

What is Container Orchestration? Benefits & How It Works
What is Container Orchestration?
Container orchestration refers to a process that deals with managing the lifecycles of containers in large, dynamic environments. It’s a tool that schedules the workload of individuated containers within many clusters, for applications based on microservices. A process of virtualization, it essentially separates and organizes services and applications at the base operating level. Orchestration is not a hypervisor since the containers are not separate from the rest of the architecture. It shares the same resources and kernel of the operating system.
Containerization has emerged as a new way for software organizations to build and maintain complex applications. Organizations that have adopted microservices in their businesses are using container platforms for application management and packaging.
The problem it solves
Scalability is the problem that containerization resolves when facing operational challenges in utilizing containers effectively. The problem begins when there are many containers and services to manage simultaneously. Their organization becomes complicated and cumbersome. Container orchestration solves that problem by offering practical methods for automating the management, deployment, scaling, networking, and availability of containers.
Microservices use containerization to deliver more scalable and agile applications. This tool gives companies complete access to a specific set of resources, either in the host’s physical or virtual operating system. It’s why containerization platforms have become one of the most sought-after tools for digital transformation.
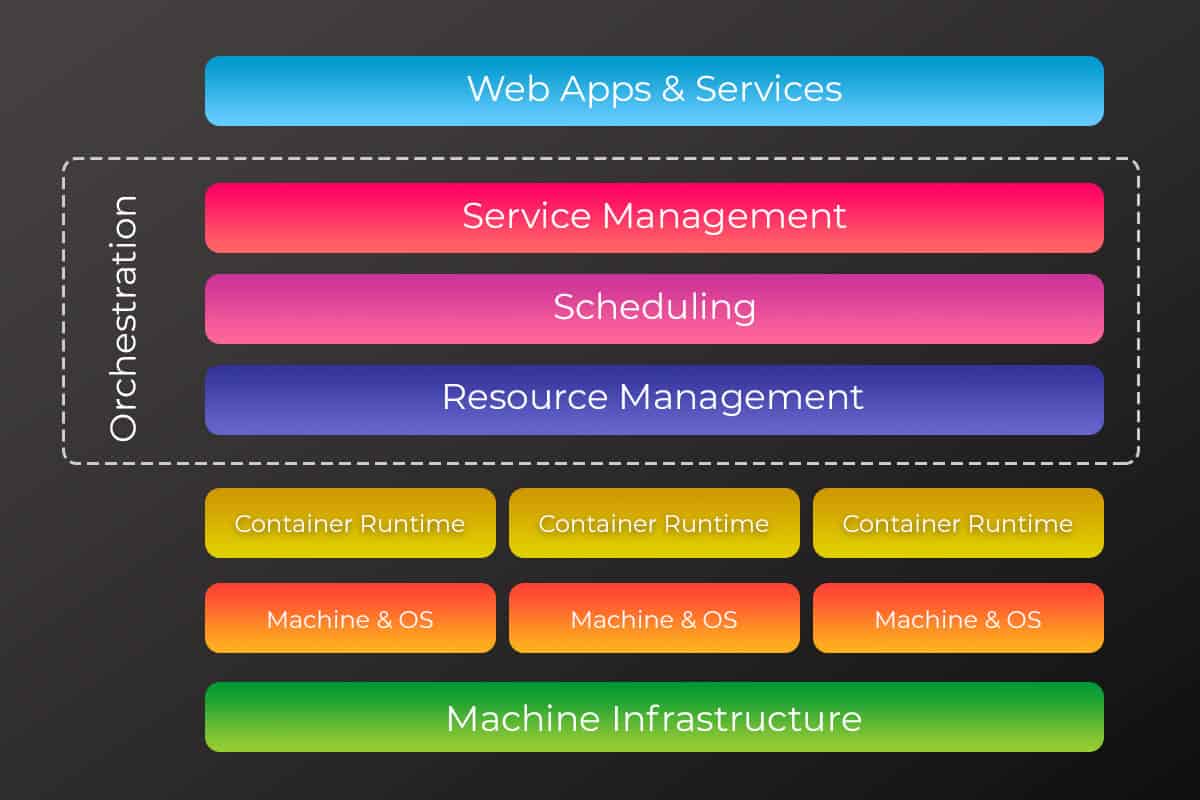
Software teams in large organizations find container orchestration a highly effective way to control and to automate a series of tasks, including;
- Container Provisioning
- Container Deployment
- Container redundancy and availability
- Removing or scaling up containers to spread the load evenly across the host’s system.
- Allocating resources between containers
- Monitoring the health of containers and hosts
- Configuring an application in relation to specific containers which are using them
- Balancing service discovery load between containers
- Assisting in the movement of containers from one host to another if resources are limited or if a host expires
To explain how containerization works we need to look at the deployment of microservices. Microservices employ containerization to deliver tiny, single-function modules. They work together to produce more scalable and agile applications. This inter-functionality of smaller components (containers) is so advantageous that you do not have to build or deploy a completely new version of your software each time you update or scale a function. It saves time, resources, and allows for flexibility that monolithic architecture cannot provide.
How Does Container Orchestration Work?
There are a host of container orchestration tools available on the market currently with Docker swarm and Kubernetes commanding the largest user-bases in the community.
Software teams use container orchestration tools to scribe the configuration of their applications. Depending on the nature of the orchestration tool being used, the file could be in a JSON or YAML format. These configuration files are responsible for directing the orchestration tool towards the location of container images. Information on other functions that the configuration file is responsible for includes establishing networking between containers, mounting storage volumes, and the location for storing logs for the particular container.
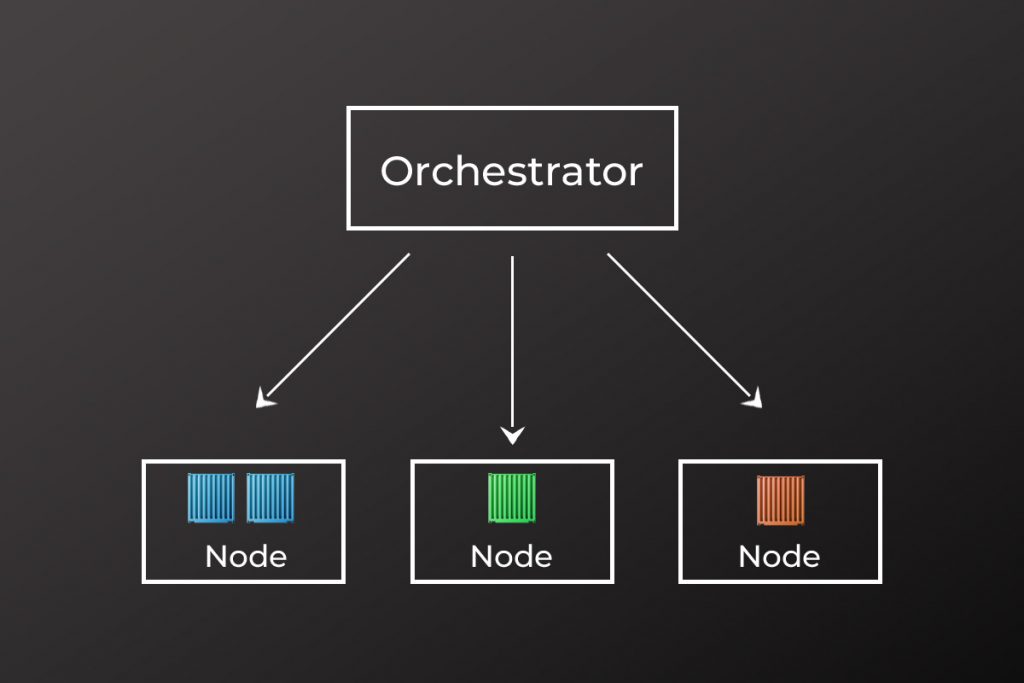
Replicated groups of containers deploy onto the hosts. The container orchestration tool subsequently schedules the deployment, once it’s time to deploy a container into a cluster. It then searches for an appropriate host to place the container, based on constraints such as CPU or memory availability. The organization of containers happens according to labels, Metadata, and their proximity to other hosts.
The orchestration tool manages the container’s lifecycle once it’s running on the host. IT follows specifications laid out by the software team in the container’s definition file. Orchestration tools are increasingly popular due to their versatility. They can work in any environment which supports containers. Thus, they support both traditional on-premise servers and public cloud instances, running on services such as Microsoft Azure or Amazon Web Services.
What are containers used for?
Making deployment of repetitive tasks and jobs easier: Containers assist or support one or several similar processes that are run in the background, i.e. batch jobs or ETL functions.
Giving enhanced support to the microservices architecture: Microservices and distributed applications are effortlessly deployed and easily isolated or scaled by implementing single container building blocks.
Lifting and shifting: Containers can ‘Lift and Shift’, which means to migrate existing applications into modern and upgraded environments.
Creating and developing new container-native apps: This aspect underlines most of the benefits of using containers, such as refactoring, which is more intensive and beneficial than ‘lift-and-shift migration’. You can also isolate test environments for new updates for existing applications.
Giving DevOps more support for (CI/CD): Container technology allows for streamlined building, testing, and deployment from the same container images and assists DevOps to achieve continuous integration and deployment.

Benefits of Containerized Orchestration Tools
Container orchestration tools, once implemented, can provide many benefits in terms of productivity, security, and portability. Below are the main advantages of containerization.
- Enhances productivity: Container orchestration has simplified installation, decreasing the number of dependency errors.
- Deployments are faster and simple: Container orchestration tools are user-friendly, allowing quick creation of new containerized applications to address increasing traffic.
- Lower overhead: Containers take up lesser system resources when you compare to hardware virtual-machine or traditional environments. Why? Operating system images are not included.
- Improvement in security: Container orchestration tools allow users to share specific resources safely, without risking security. Web application security is further enhanced by application isolation, which separates each application’s process into separate containers.
- Increase in Portability: Container orchestration allows users to scale applications with a single command. It only provides scale specific functions which do not affect the entire application.
- Immutability: Container orchestration can encourage the development of distributed systems, adhering to the principles of immutable infrastructure, which cannot be affected by user modifications.
Container Orchestration Tools: Kubernetes vs. Docker Swarm
Kubernetes and Docker are the two current market leaders in building and managing containers.
Docker, when first became available, became synonymous with containerization. It’s a runtime environment that creates and builds software inside containers. According to Statista, over 50% of IT leaders reported using Docker container technology in their companies last year. Kubernetes is a container orchestrator. It recognizes multiple container runtime environments, such as Docker.
To understand the differences between Kubernetes and Docker Swarm, we should examine it more closely. Each has its own sets of merits and disadvantages, which makes the task of choosing between one of them, a tough one. Indeed, both the technologies differ in some fundamental ways, as evidenced below:
| Points of Difference | Kubernetes | Docker Swarm |
| Container Setup | Docker Compose or Docker CLI cannot define containers. Kubernetes instead uses its own YAML, client definitions, and API. These differ from standard docker equivalents. | The Docker Swarm API offers much of the same functionality of Dockers, although it does not recognize all of Docker’s commands. |
| High Availability | Pods are distributed among nodes, offering high availability as it tolerates the failure of an application. Load balancing services detect unhealthy pods and destroys them. | Docker Swarm also offers high availability as the services can replicate via swarm nodes. The entire cluster is managed by Docker Swarm’s Swarm manager nodes, which also handle the resources of worker nodes. |
| Load Balancing | In most instances, an ingress is necessary for load balancing purposes. | A DNS element inside Swarm nodes can distribute incoming requests to a service name. These services can run on ports defined by the user, or be assigned automatically. |
| Scalability | Since Kubernetes has a comprehensive and complex framework, it tends to provide strong guarantees about a unified set of APIs as well as the cluster state. This setup slows downscaling and deployment. | Docker Swarm is Deploys containers much faster, allowing faster reaction times for achieving scalability. |
| Application Definition | Applications deploy in Kubernetes via a combination of microservices, pods, and deployments. | Applications deploy either as microservices or series in a swarm cluster. Docker-compose helps in installing the application. |
| Networking | Kubernetes has a flat networking model. This setup allows all pods to interact with each other according to network specifications. To do so, it implements as an overlay. | As a node joins a swarm cluster, an overlay network will generate. This overlay network covers every host in the docker swarm, along with a host-only docker bridge network. |
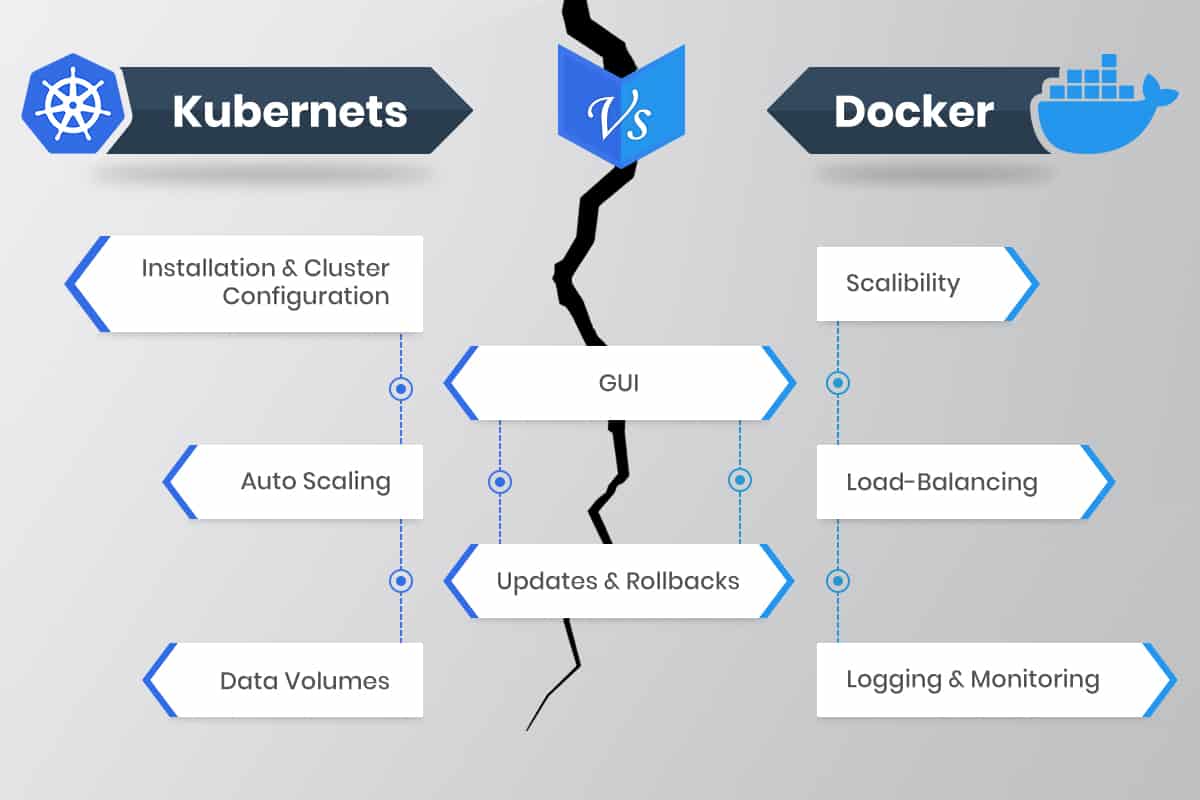
Which Containerization Tool to Use?
Container orchestration tools are still fledgling and constantly evolving technologies. Users should make their decision after looking at a variety of factors such as architecture, flexibility, high availability needs, and learning curve. Besides the two popular tools, Kubernetes and Docker Swarm, there are also a host of other third-party tools and software associated with them both, which allow for continuous deployment.
Kubernetes currently stands as the clear standard when it comes to container orchestration. Many cloud service providers as Google and Microsoft have started offering “Kubernetes-as-a-service” options. Yet, if you’re starting and running a smaller deployment without a lot to scale, then Docker Swarm is the way to go. Read our in-depth article on the key differences between Kubernetes vs Docker Swarm.
To get support with your container development and CI/CD pipeline, or find out how advanced container orchestration can enhance your microservices, connect with one of our experts to explore your options today.

Kubernetes vs OpenShift: Key Differences Compared
With serverless computing and container technology being at the forefront, the demand for container technology has risen considerably. Container management platforms such as Kubernetes and OpenShift may be well-known, though possibly not as well understood.
Both Kubernetes and OpenShift consist of modern, future proof architecture, which is also robust and scalable. Due to the similarities, the decision to choose one of the two platforms can be difficult. In this article, we compare Kubernetes versus OpenShift in detail and examine the fundamental differences and unique benefits each provides.
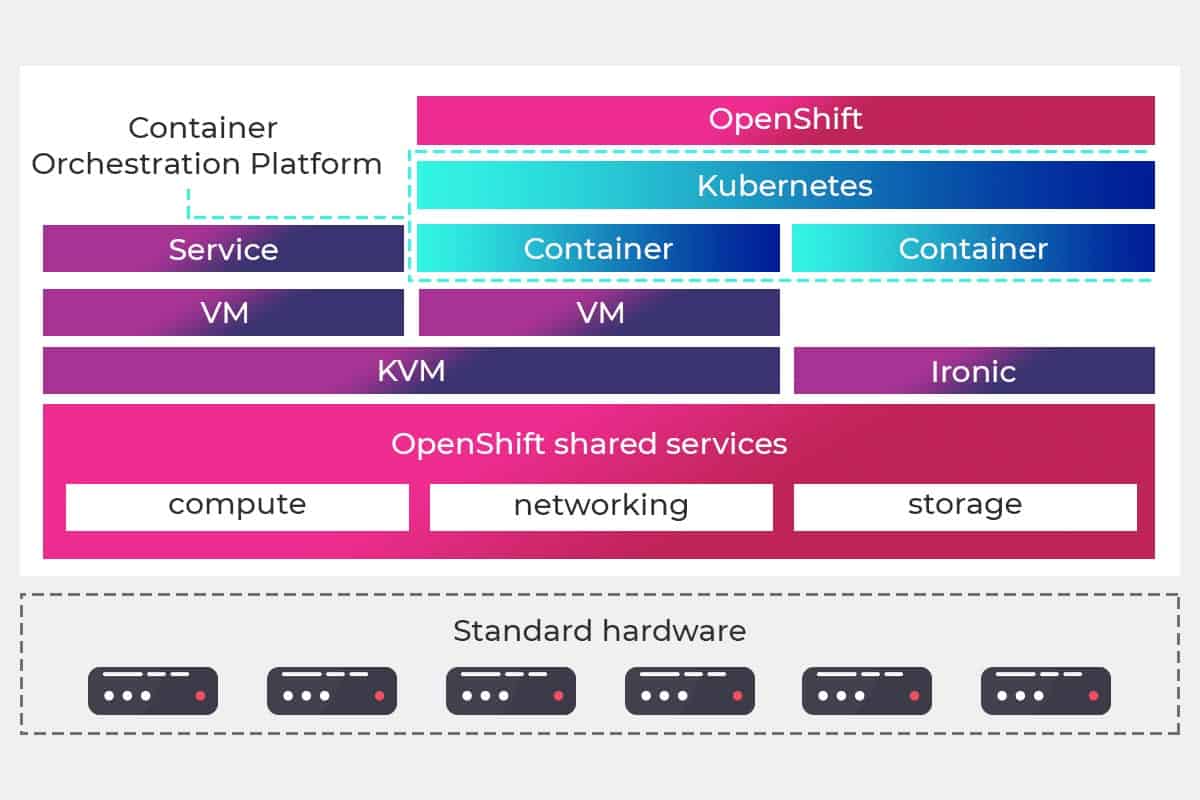
What is Kubernetes?
Kubernetes is an open-source container as a service platform (CaaS) that can automate deploying, scaling, and managing containerized apps to speed up the development procedure. Originally developed at Google, the product was later handed over to the Cloud Native Computing Foundation under the Linux Foundation.
Many cloud services tend to offer a variant of a Kubernetes based platform or infrastructure as a service. Here, Kubernetes can be deployed as a platform-providing service, with many vendors providing their own branded distributions of Kubernetes.
Key Features of Kubernetes
- Storage Orchestration: Allows Kubernetes to integrate with most storage systems, such as AWS Elastic Storage.
- Container Balancing: IT enables Kubernetes to calculate the best location for a container automatically.
- Scalability: Kubernetes allow horizontal scaling. This setup allows for organizations to scale out their storage, depending on their workload requirements.
- Flexibility: Kubernetes can be run in multiple environments, including on-premises, public, or hybrid cloud infrastructures.
- Self-Monitoring: Kubernetes provides monitoring capabilities to help check the health of servers and containers.
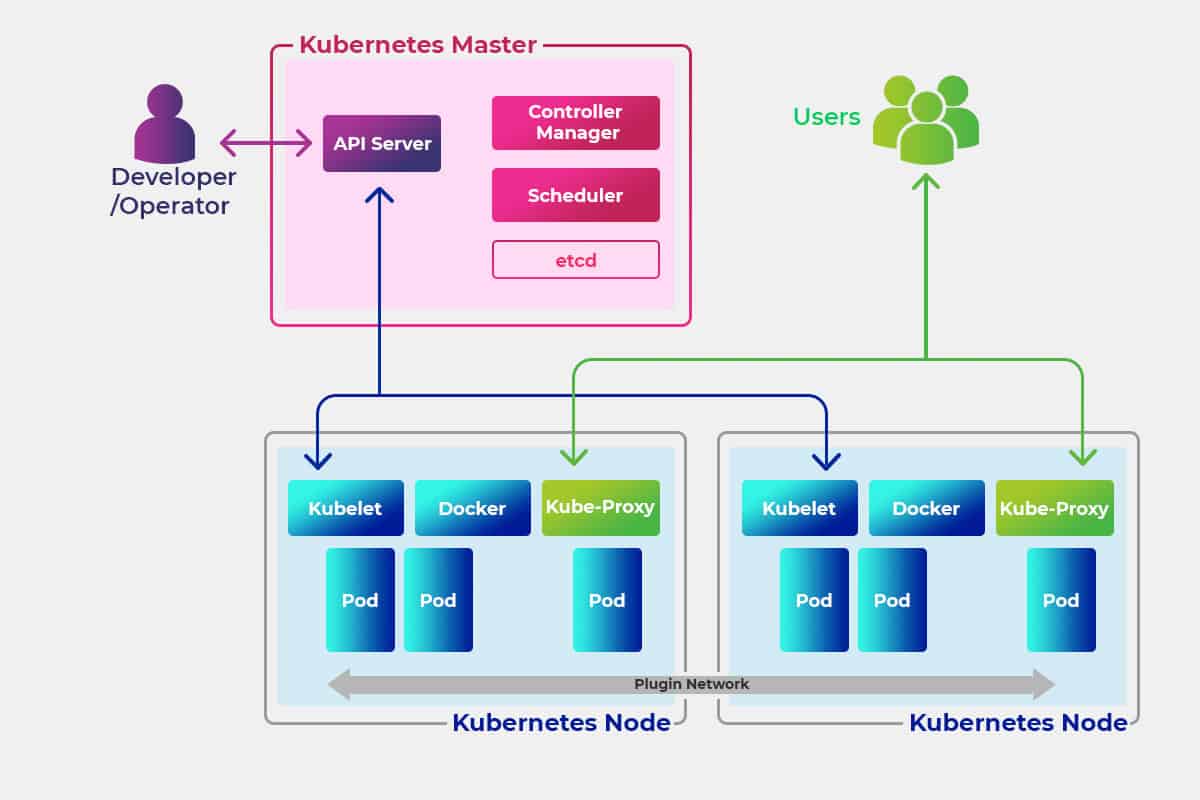
Why Choose Kubernetes?
A significant part of the industry prefers Kubernetes due to the following reasons:
- Strong Application Support – Kubernetes has added support for a broad spectrum of programming frameworks and languages, which enables it to satisfy a variety of use cases
- Mature Architecture: The architecture of Kubernetes is preferred because of its association with Google’s Engineers, who have worked on the product for almost ten years.
- Developmental Support: Because Kubernetes has a large and active online user community, new features get added frequently. Additionally, the user community also provides technical support that encourages collaborations.
What is OpenShift?
OpenShift is also a containerization software solution, possessing an Apache License. Developed by Red Hat. Its original product is the OpenShift container platform, a Platform-as-a-Service (PaaS), which can be managed by Kubernetes. Termed as the ‘Enterprise Kubernetes,’ the program is written in a combination of both Go and AngularJS languages. Its primary function allows developers to deploy and develop apps directly on the cloud. It also appends tools over a Kubernetes core to quicken the process.
A substantial change came with the recent introduction of OpenShift V3 (released October 2019). Before the release of this version, custom-developed technologies had to be used for container orchestration. With V3, OpenShift added Docker as their prime container technology, and Kubernetes as the prime container orchestration technology, which will be continued in subsequent releases.
OpenShift brings along with it a set of products such as the OpenShift Container Platform, OpenShift Dedicated, Red Hat OpenShift Online, and OpenShift origin.
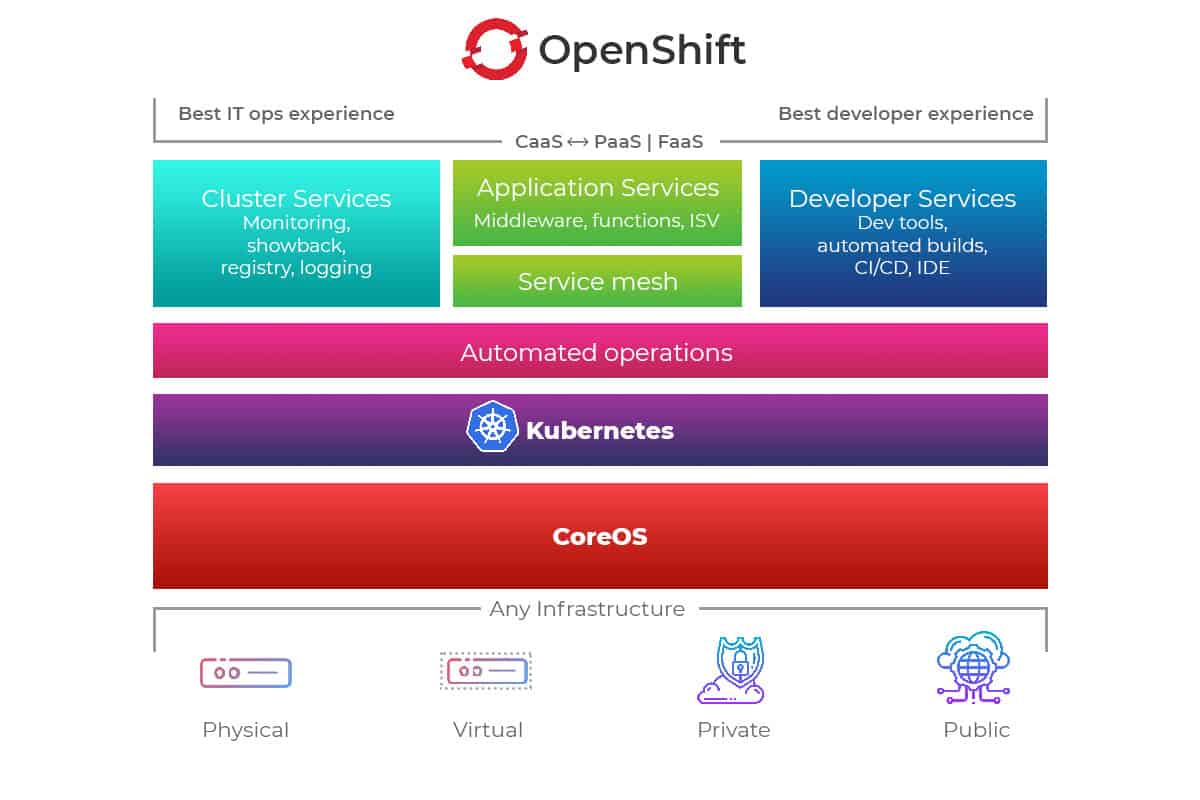
Key Features of OpenShift
- Compatibility: As part of the certified Kubernetes program, OpenShift has compatibility with Kubernetes container workloads.
- Constant Security: OpenShift has security checks that are built into the container stack.
- Centralized policy management: OpenShift has a single console across clusters. This control panel provides users with a centralized place to implement policies.
- Built-in Monitoring: OpenShift comes with Prometheus, which is a devops database and application monitoring tool. It allows users to visualize the applications in real-time, using a Grafana dashboard.
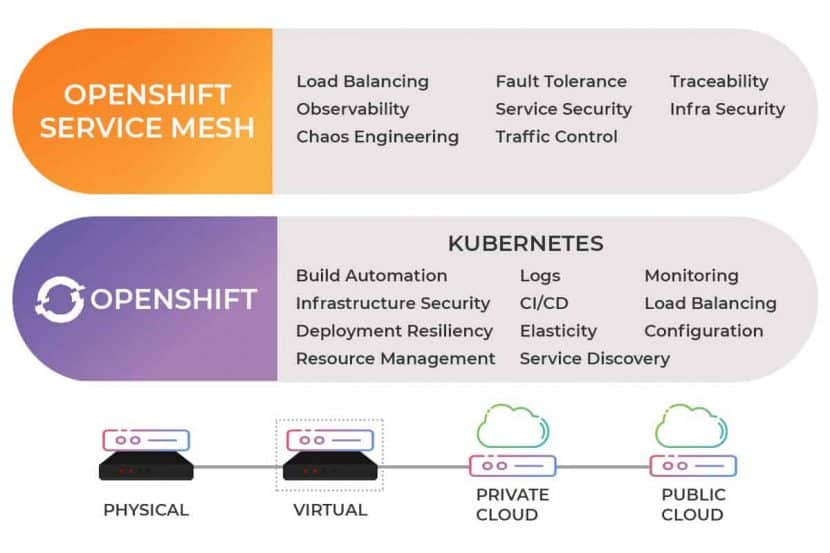
Why Choose OpenShift?
Popular reason users prefer OpenShift are highlighted below:
- Self-service Provisioning: OpenShift provides users with the capability of integrating the tools they use the most. For instance, as a result of this, a video game developer can use OpenShift while developing games.
- Faster Application Development: Can stream and automate the entire container management process, which in turn enhances the DevOps process.
- No vendor lock-in: Provides a vendor-agnostic open-source platform, allowing users to migrate their own container processes to other operating systems as required without having to take any extra step.
What is the difference Between OpenShift and Kubernetes?
OpenShift and Kubernetes share many foundational and functional similarities since OpenShift is intentionally based on Kubernetes. Yet, there are other fundamental technical differences explained in the table below.
| Points of Difference | Kubernetes | OpenShift |
| Programming Language Used | Go | Angular JS and Go |
| Release Year | 2014 | 2011 |
| Developed by | Cloud-Native Computing Foundation | Red Hat |
| Origin | It was released as an open-source framework or project, and not as a product | It is a product, but with many variations. For example, open-source OpenShift is not a project and rather an OKD. |
| Base | Kubernetes is flexible when it comes to running on different operating systems. However, RPM is the preferred package manager, which is a Linux distribution. It is preferred that Kubernetes be run on Ubuntu, Fedora, and Debian. This setup allows it to run on major LaaS platforms like AWS, GCP, and Azure. | OpenShift, on the other hand, can be installed on the Red Hat Enterprise Linux or RHEL, as well as the Red Hat Enterprise Linux Atomic Host. Thus, it can also run on CentOS and Fedora. |
| Web UI | The dashboard inside Kubernetes requires separate installation and can be accessed only through the Kube proxy for forwarding a port of the user’s local machine to the cluster admin’s server. Since it lacks a login page, users need to create a bearer token for authorization and authentication manually. All this makes the Web UI complicated and not suited for daily administrative work. | OpenShift comes with a login page, which can be easily accessed. It provides users with the ability to create and change resources using a form. Users can thus visualize servers, cluster roles, and even projects, using the web. |
| Networking | It does not include a native networking solution and only offers an interface that can be used by network plugins made by third parties. | IT includes a native networking solution called Open Switch, which provides three different plugins. |
| Rollout | Kubernetes provides a myriad of solutions to create Kubernetes clusters. Users can use installers such as Rancher Kubernetes Everywhere or Kops. | OpenShift does not require any additional components after the rollout. It thus comes with a proprietary Ansible based installer, with the capabilities of installing OpenShift with the minimum configuration parameters. |
| Integrated Image Registry | Kubernetes does not have any concept of integrated image registries. Users can set up their own Docker registry. | OpenShift includes their image registry, which can be used with Red Hat or DockerHub. It also allows users to search for information regarding images and image streams related to projects, via a registry console. |
| Key Cloud Platform Availability | It is available on EKS for Amazon AWS, AKS for Microsoft Azure, and GKE for Google GCP. | Has a product known as OpenShift Online, OpenShift Dedicated, as well as OpenShift on Azure. |
| CI/CD | Possible with Jenkins but is not integrated within it. | Seamless integration with Jenkins is available. |
| Updates | Supports many concurrent updates simultaneously | Does not support concurrent updates |
| Learning Curve | It has a complicated web console, which makes it difficult for novices. | It has a very user-friendly web console ideal for novices. |
| Security and authentication | Does not have a well-defined security protocol | Has secure policies and stricter security models |
| Who Uses it | HCA Healthcare, BMW, Intermountain Healthcare, ThoughtWorks, Deutsche Bank, Optus, Worldpay Inc, etc. | NAV, Nokia, IBM, Phillips, AppDirect, Spotify, Anti Financial, China Unicom, Amadeus, Bose, eBay, Comcast, etc. |
Evident in the comparison table are their similar features. Kubernetes and OpenShift are both open-source software platforms that facilitate application development via container orchestration. They make managing and deploying containerized apps easy. OpenShift’s web console which allows users to perform most tasks directly on it.
Both facilitate faster application development. OpenShift has a slight advantage when it comes to easy installations, primarily since it relies on Kubernetes to a high degree. Kubernetes does not have a proper strategy in place for installation, despite being the more advanced option. Installing Kubernetes requires managed Kubernetes clusters or a turnkey solution.
OpenShift has also introduced many built-in components and out-of-the-box features to make the process of containerization, faster. Below is a broader comparison table of their points of difference:
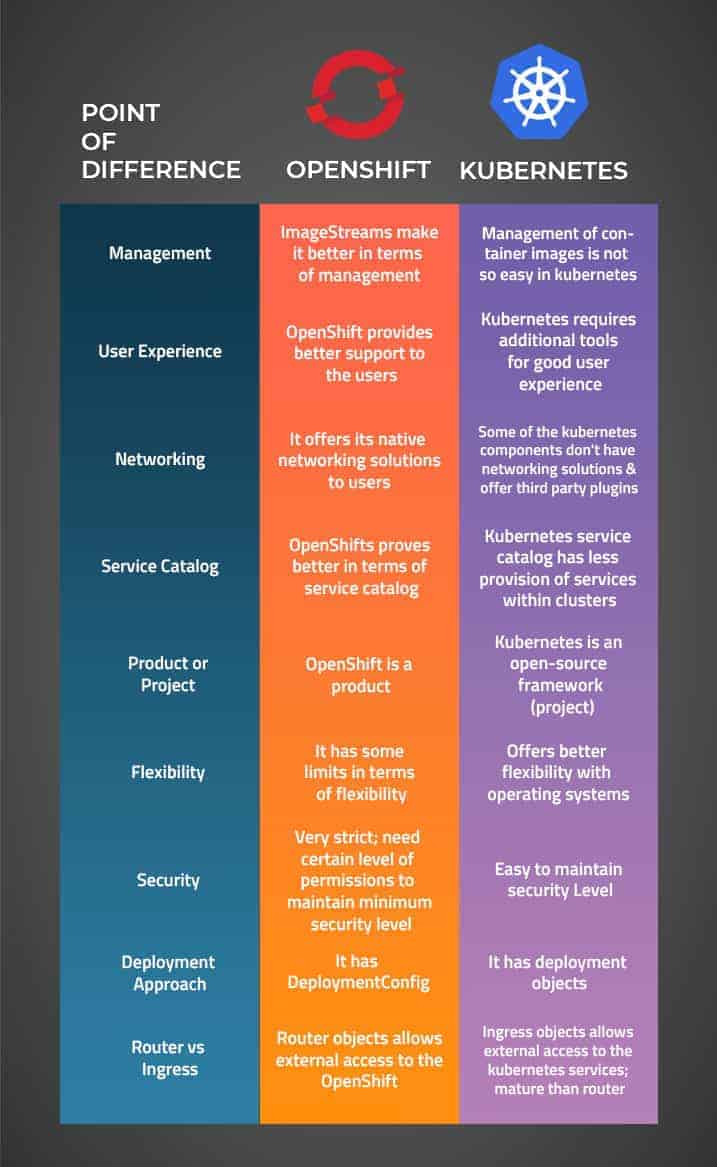
Making the Decision: Kubernetes or OpenShift?
Which one you decide to use will come down to the requirements of your system and the application you’re building.
The question to ask in the Kubernetes vs. OpenShift debate is figuring out what features take precedence: Flexibility or an excellent web interface for the development process? Notwithstanding IT experience, infrastructure, and expertise to handle the entire development lifecycle of the application.
Want more information? Connect with us, and allow us to assist you in containerizing your development processes.